Released: 2023-11-29
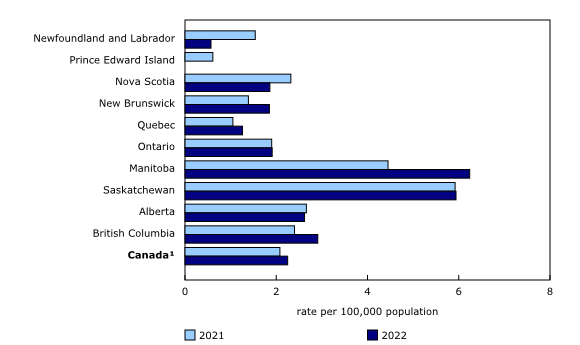
In 2022, police services across Canada reported 874 homicides, 78 more than in the previous year. The national homicide rate rose by 8% to 2.25 homicides per 100,000 population, representing a fourth consecutive yearly increase. The homicide rate is widely considered a key metric for assessing the state of violence in society. Despite recent increases, homicides remain a rare event in Canada, accounting for less than 0.2% of all police-reported violent crimes in 2022.
The following article takes a closer look at the characteristics and trends of homicide in Canada.
Manitoba sees the largest homicide rate increase
Among the provinces, Manitoba (+40%) saw the largest homicide rate increase, from 4.45 homicides per 100,000 population in 2021 to 6.24 in 2022. This was also the highest rate among the provinces. This rise comes from 26 additional homicides, compared with the previous year, with 11 more homicides occurring in the census metropolitan area (CMA) of Winnipeg. New Brunswick (+33%), British Columbia (+21%), Quebec (+21%) and Ontario (+1%) also recorded higher homicide rates, compared with 2021.
Thunder Bay (12.05 homicides per 100,000 population) had the highest homicide rate among CMAs in 2022, with more than double the number of homicides recorded in 2021 (15 compared with 6). Historically, Thunder Bay has frequently had the highest homicide rate in Canada. However, the rate in 2022 was significantly higher than its previous 10-year average (5.60). This can be attributed to a notable increase in the number of homicides related to illegal drug trade activities in 2022 (9), compared with 2021 (3). Winnipeg (6.10 homicides per 100,000 population) had the second-highest homicide rate in 2022, while Greater Sudbury (5.83) had the third-highest.
Firearms seized in nearly one in five homicide incidents
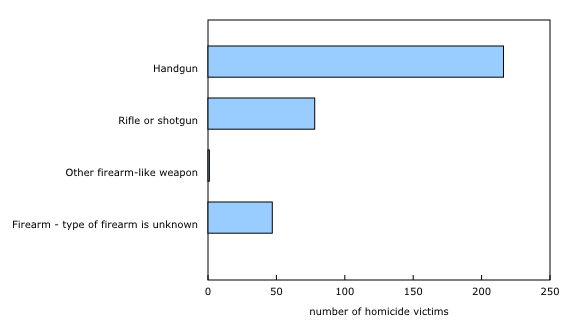
Firearm-related homicides accounted for 41% of all homicides in 2022, which was similar to the proportion in 2021 (40%). Among the 342 firearm-related homicides, 63% were committed with a handgun, 23% were committed with a rifle or shotgun, and 14% were committed with another type of firearm or a firearm of unknown type.
For approximately one in five homicide incidents (19%) in 2022, firearms were seized as part of the incident. Throughout a homicide investigation, police are legally permitted to seize firearms for a number of reasons, including public safety or as part of evidence collection. These firearms do not need to have been used to commit the homicide. Among these incidents, an average of two firearms were seized.
In 2022, police reported that firearms were recovered in 15% of homicide incidents. This includes firearms that were found or turned over to police. This also includes firearms that were previously listed by police as stolen but were later recovered/found. These firearms do not need to have been used to commit the homicide. Among these incidents, an average of two firearms were recovered.
Among homicide incidents, a total of 19 firearms were reported to police as stolen in 2022, excluding firearms that were previously reported as stolen and recovered as part of homicide incidents. The collection of information on firearms recovered, seized and stolen as part of homicide incidents was introduced in 2022. Among all three areas (firearms seized, recovered and stolen), data were unknown for less than 3% of homicide incidents.
For the purposes of the Homicide Survey, an incident is defined as the occurrence of one or more homicides during a single, distinct event. If there are multiple victims or multiple accused people, the homicides must occur at the same location and at the same time if they are to be included within the same incident. If this is not the case, they are recorded as separate incidents.
Gang-related homicides continue to account for nearly one-quarter of all homicides
Gang-related homicides (202 homicides, or 0.52 homicides per 100,000 population) were a large contributor to the overall national homicide increase, with 18 more gang-related homicides in 2022 than in 2021. However, they continued to account for nearly one-quarter (23%) of all homicides. The majority (161 homicides, or 82%) were committed with a firearm, most often a handgun (70%). Gang-related homicides committed with a firearm represented 18% of all homicides, a similar proportion as in 2021 (17%).
Marked increase in the number of youths accused of homicide
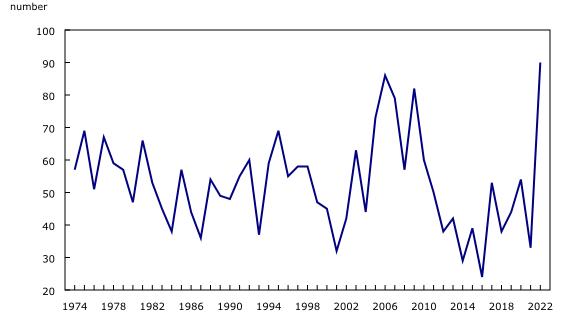
There was an increase in the number of charged/suspect-chargeable (accused) individuals aged younger than 18 years in 2022. Among cleared homicides, police services reported that there were 90 youths accused of homicide in 2022, compared with 33 in 2021 and an average of 39 over the previous 10 years. The rate of youths accused of homicide was 2.2 times greater in 2022 (1.23 per 100,000 youths) than the previous 10-year average (0.56 per 100,000 youths).
This increase can be largely attributed to a rise in the number of homicide incidents involving multiple accused individuals aged younger than 18 years. In 2022, police reported 19 incidents with two or more youths accused of homicide, compared with an average of 5 incidents in the previous 10 years. There were 7 incidents with three or more youths accused of homicide in 2022, compared with an average of 1 incident in the previous 10 years.
In 2022, close to one in five youths accused of homicide (16%) were involved in a gang-related homicide. This excludes 1% of youths accused of homicide for which this information is unknown.
The rate of homicides involving Indigenous victims remains disproportionally high
The overarching and ongoing legacy of colonization in Canada continues to shape the experiences of Indigenous people to this day. Impacts include widespread socioeconomic marginalization, systemic discrimination, overt and systemic racism, intergenerational trauma, land displacement, and persisting settler-colonial attitudes and logic. The sum of these experiences plays a crucial role in the fact that First Nations people, Inuit and Métis are over-represented in the Canadian criminal justice system as both victims and accused persons.
In 2022, 225 homicide victims were Indigenous, representing just over one-quarter of homicide victims (27%), a slightly higher proportion than the previous year (24%). The rate of homicide involving Indigenous victims remained disproportionately high, with 10.98 victims per 100,000 Indigenous people. This was more than six times the homicide rate of non-Indigenous people (1.69 per 100,000). Among Indigenous victims where the gender was known, 169 were men and 53 were women.
Approximately one-third of homicide victims are racialized people
Evidence shows that racialized people face various experiences impacting their involvement in the criminal justice system as both victims and accused persons. These experiences include overt and systemic racism, systemic discrimination, and structural and individual inequalities, such as socioeconomic marginalization. According to the 2021 Census of Population, one in four people in Canada (26.5%) were from the racialized population.
In 2022, 265 homicide victims were identified by the police as being racialized people, representing 30% of the 874 reported homicide victims. The homicide rate for racialized individuals was 2.49 victims per 100,000 population, which was slightly higher than the homicide rate for non-racialized individuals (2.12 per 100,000). Among racialized homicide victims, over 4 in 10 (43%) were Black and just over one-quarter (27%) were South Asian. Among racialized victims where the gender was known, 208 racialized homicide victims were men and 53 were women.
Five police officers killed because of their occupation in 2022
In 2022, there were five homicides of police officers. Police victims include those killed because of their occupation, regardless of whether they were on or off duty at the time of their homicide. This latest figure is higher than the average for the previous 10 years (two police victims) and it is the highest number observed since 1985, when five police officers were victims of homicides.
Since 2019, close to one in six homicides have been witnessed by a child or youth
Police services report that an average of 15% of homicides have been witnessed by a child or youth since the collection of this information began in 2019. This excludes 9% of homicides for which this information is unknown. The average from 2019 to 2022 increased to 18% when looking at homicides involving a spousal, family or intimate partner relationship between the victim and the accused person. Data show that children and youth are also witnesses to homicides related to gang and organized crime activities (12%), and the illegal drug trade (9%).
Most homicides witnessed by a child or youth (59%) occurred within a residential location, while the rest occurred mainly on a street, road or highway; in a parking lot; or in an open area, such as a park, playground or field.
Note to readers
Data presented in this article are drawn from the Homicide Survey, which has collected police-reported information on the characteristics of homicide incidents, victims and accused people in Canada since 1961. Detailed information about the Homicide Survey can be accessed on Statistics Canada’s website.
Comparisons between provinces and territories were excluded from the analysis. Variations in year-over-year homicide rates within the territories must be interpreted with caution because of their relatively small population sizes.
Because of diverging methodologies regarding annual revisions to databases, data reported before 2021 may not match homicide counts reported by the Uniform Crime Reporting Survey.
Detailed tables on homicides in Canada are also available.
Defining Indigenous identity
For the purposes of the Homicide Survey, Indigenous identity includes people identified as First Nations people (either status or non-status), Métis or Inuit, and people with an Indigenous identity whose Indigenous group is not known to police. Non-Indigenous identity refers to instances where the police have confirmed that a victim or accused person is not identified as an Indigenous person. Indigenous identity reported as “unknown” by police includes instances where police are unable to determine the Indigenous identity of the victim or accused person, where Indigenous identity is not collected by the police service, or where the accused person has refused to disclose their Indigenous identity to police.
Defining racialized population
The concept of “racialized groups” is measured with the “visible minority” variable in this release. There is currently no definition or standard for “racialized groups.” Until further notice, derivation and dissemination of data for “racialized groups” follows the visible minority of person standard. “Visible minority” refers to whether a person belongs to one of the visible minority groups defined by the Employment Equity Act. The act defines visible minorities as “persons, other than Aboriginal peoples, who are non-Caucasian in race or non-White in colour.” The visible minority population consists of the following groups: South Asian, Chinese, Black, Filipino, Latin American, Arab, Southeast Asian, West Asian, Korean and Japanese. The concept of “rest of the population” is used to include any victim or accused person excluded from the concept of “racialized groups” or “visible minority.” For the purposes of the Homicide Survey, an individual’s “visible minority” status is identified by police.
Products
The “Infographic: Homicide in Canada, 2022” (11-627-M) is now available. The Data Visualization Product “Police-reported Information Hub: Homicide in Canada” (71-607-X) will be released at a later date.
Additional data are available upon request.
Contact information
For more information, or to enquire about the concepts, methods or data quality of this release, contact us (toll-free 1-800-263-1136; 514-283-8300; infostats@statcan.gc.ca) or Media Relations (statcan.mediahotline-ligneinfomedias.statcan@statcan.gc.ca).


