Unfinished Business: Reductions in Incarceration and Disparities
Reforms of the past two decades have reduced both the footprint of the criminal legal system and its racial disparities. But we remain far from ending mass incarceration or its racial and ethnic inequality. As national and local politics resume the politicization of crime and drug policies, it is crucial to take stock of the progress that must be defended and built upon.
Imprisonment: Broad Trends
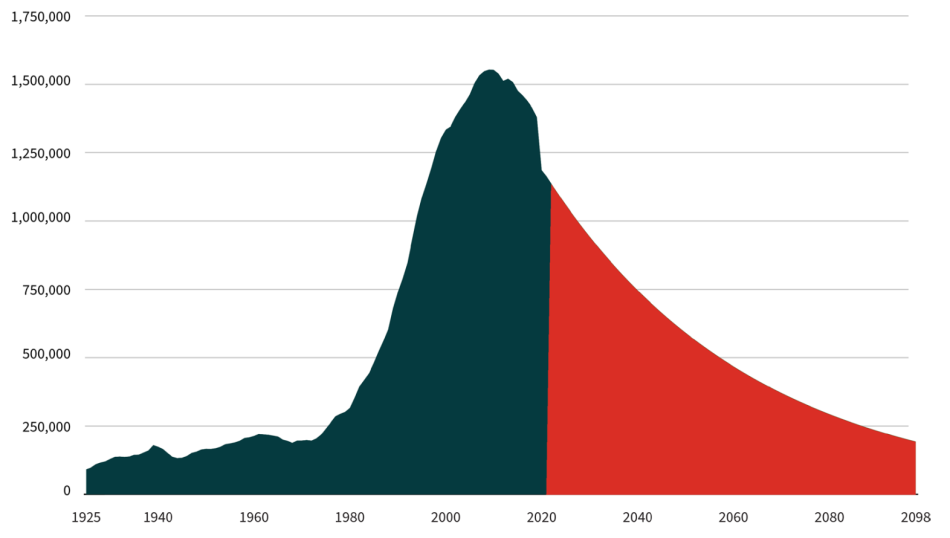
U.S. prisons held 1.2 million people in 2021, reflecting a 25% reduction from peak year 2009. While notable, this pace of prison downsizing is insufficient in the face of the nearly 700% buildup in imprisonment since 1972. The prison population in 2021 was nearly six times as large as 50 years ago, before the era of mass incarceration. The prison and jail incarceration rate in the United States remains between five and eight times that of France, Canada, and Germany and imprisonment rates in Mississippi, Louisiana, Arkansas, and Oklahoma are nearly 50% above the national average. At the recent pace of decarceration nationwide, it would take 75 years—until 2098—to return to the size of 1972’s prison population.
Figure 1. Historical and Projected U.S. State and Federal Prison Population Based on 2009-2021 Rate of Declilne
Source of historical figures: Bureau of Justice Statistics. (1982). Prisoners 1925-81; Bureau of Justice Statistics Corrections Statistical Analysis Tool; Carson, E.A. (2022). Prisoners in 2021-Statistical tables. Bureau of Justice Statistics.
Past reforms have helped to reduce the number of people imprisoned for a drug offense by 46% between peak year 2007 and 2020. The number of people imprisoned for a property offense has declined 46% between peak year 2007 and 2020. But for the majority (56%) of the prison population imprisoned for a violent crime—which generally ranges from robbery and assault to rape and murder—sentencing relief remains elusive. Overall, the number of people imprisoned for a violent offense has declined by only 10% between peak year 2009 and 2020, despite violent crimes falling by 50% between peak year 1991 and 2020. Longer prison terms have prevented this segment of the prison population from contracting amidst a historic crime drop.
Imprisonment: Racial and Ethnic Disparities
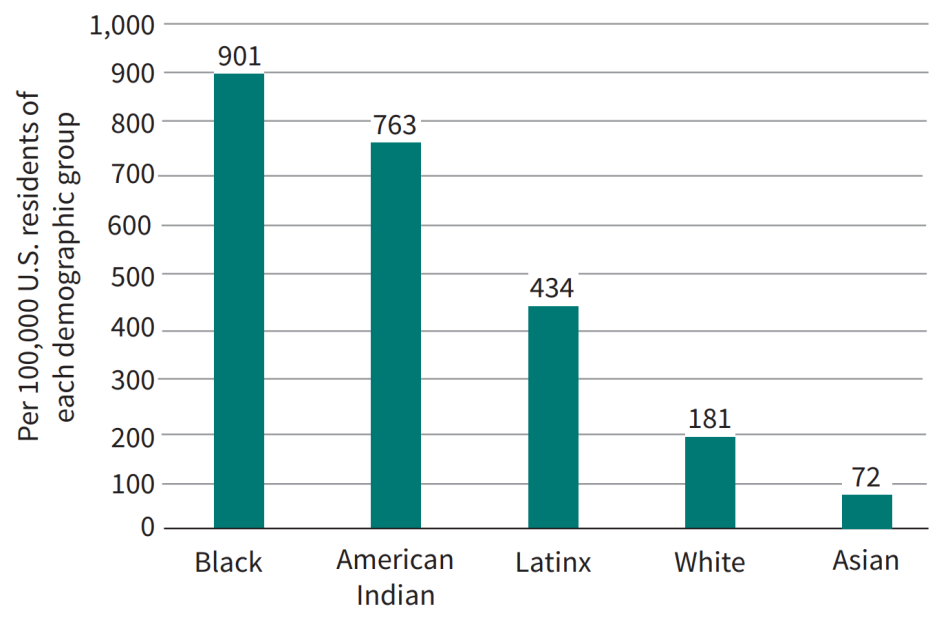
People of color—particularly African Americans—experience imprisonment at a far higher rate than whites. The experience of imprisonment is concentrated among people with lower levels of education, wealth, and income but racial disparities in imprisonment exist across all socioeconomic groups. In 2021, Black Americans were imprisoned at 5.0 times the rate of whites, while American Indians and Latinx people were imprisoned at 4.2 times and 2.4 times the white rate, respectively. These disparities are even more stark in seven states that imprison their Black residents at over 9 times the rate of their white residents: California, Connecticut, Iowa, Minnesota, New Jersey, Maine, and Wisconsin.
Figure 2. Imprisonment Rates by Race and Ethnicity, 2021
Source: Carson, E. A. (2022). Prisoners in 2021 – Statistical tables. Bureau of Justice Statistics.
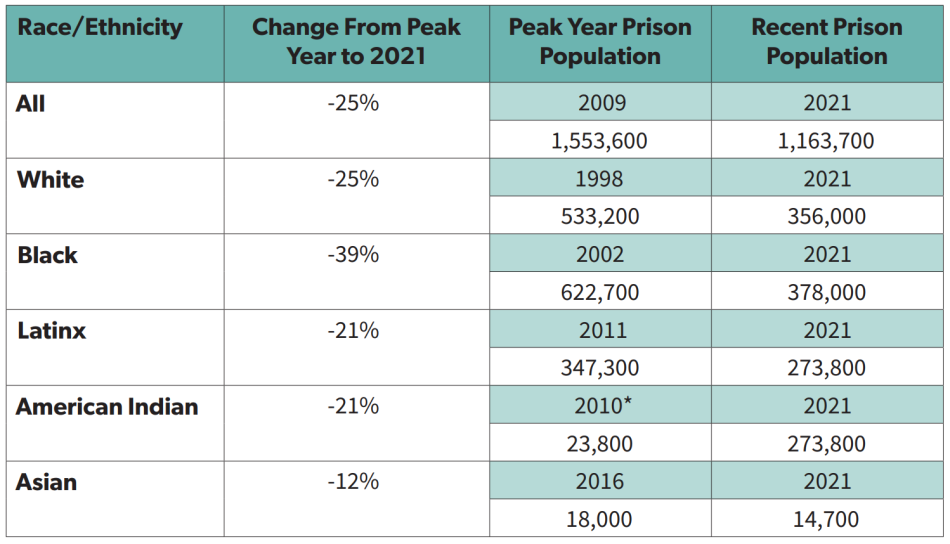
These national trends represent both persistent injustices which must be corrected, as well as dramatic progress in the past two decades. While all major racial and ethnic groups experienced decarceration since reaching their peak levels, the Black prison population has downsized the most. Reforms to drug-related law enforcement, charging, and sentencing, especially in urban areas which are disproportionately home to communities of color, have helped to drive decarceration for Black Americans. While the total U.S. prison population has downsized by 25% since reaching its peak level in 2009, the Black prison population has downsized by 39% since its peak in 2002. As shown next, this trend has narrowed, but not eliminated, disparities.
Table 1. Reductions in U.S. Prison Population Since Peak Year
Source: Bureau of Justice Statistics Prisoners Series and Correctional Populations in the United States.
*2010 is the oldest year for which comparable data are available for American Indians and may not represent the peak year.
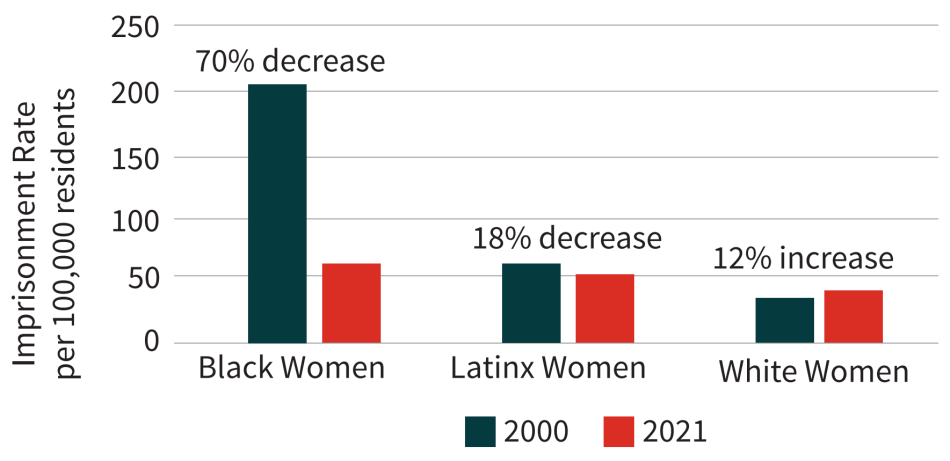
A similar trend can be seen in imprisonment rates, which represent prison populations as a percentage of the total relevant populations. Looking at imprisonment rates by gender reveals that Black women experienced the most dramatic decline in imprisonment—70%—between 2000 and 2021. Still, Black women were imprisoned at 1.6 times the rate of white women in 2021.
Figure 3. Female Imprisonment Rates: 2000 vs. 2021
Source: Carson, E. A. (2022). Prisoners in 2021 – Statistical tables. Bureau of Justice Statistics; Beck, A. J., & Harrison, P. M. (2001). Prisoners in 2000. Bureau of Justice Statistics.
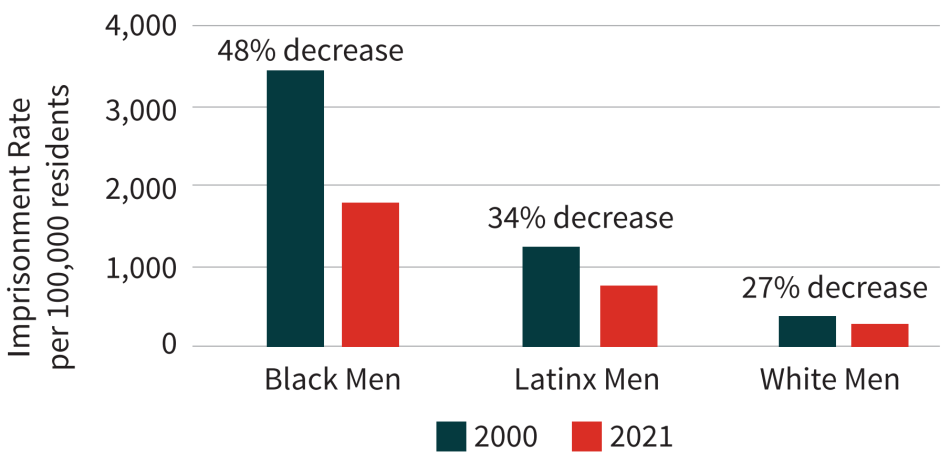
Figure 4. Male Imprisonment Rates: 2000 vs. 2021
Source: Carson, E. A. (2022). Prisoners in 2021 – Statistical tables. Bureau of Justice Statistics; Beck, A. J., & Harrison, P. M. (2001). Prisoners in 2000. Bureau of Justice Statistics.
The imprisonment rate of Black men also declined substantially, falling by almost half. Still, Black men were imprisoned at 5.5 times the rate of white men in 2021. Decarceration among Latinx men and women also outpaced that of whites, but Latinx women, and even more so men, remain imprisoned at higher rates than whites.
Examining the cumulative likelihood of male imprisonment over a lifetime, scholars have highlighted a “generational shift” among Black men. For Black men, the lifetime risk of imprisonment fell from 1 in 3 for those born in 1981 to 1 in 5 for those born in 2001. This 42% reduction outpaced the 29% reduction in lifetime imprisonment for white men and the 17% reduction for Latinx men. “But several factors caution against being overly sanguine,” the researchers warn, notably the persistence of mass incarceration and its disparities. Among those born in 2001, Black men were 4.1 times as likely to be imprisoned within their lifetimes compared to white men, and Latinx men were 2.5 times as likely as white men.
Figure 5. Lifetime Likelihood of Imprisonment of U.S. Males Born in 2001

Source: Robey, J., Massoglia, M., & Light, M. (2023). A generational shift: Race and the declining lifetime risk of imprisonment. Demography, Appendix Table A6.
While these promising trends demonstrate the effectiveness of reforms to narrow racial and ethnic disparities in incarceration, far more work is needed to achieve equity.
Jail Incarceration
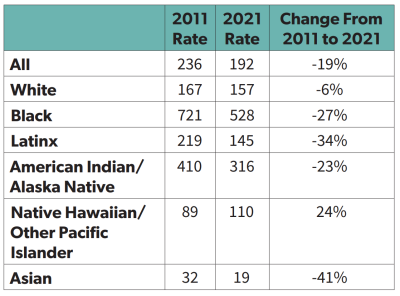
Jail populations have also downsized in recent years, with racial disparities decreasing as well. The 636,000 people jailed in 2021 represented a 19% decline from the historic high of 786,000 people jailed in 2008. In fact, jail incarceration rates have declined most substantially for non-white populations in the past decade. The decline in the Latinx jail incarceration rate has resulted in this population experiencing a lower jail incarceration rate than whites in 2021 (145 per 100,000 versus 157 per 100,000).
Table 2. Jail Incarceration Rates, Per 100,000 Residents: 2011 vs. 2021
Source: Zeng, Z. (2022). Jail inmates in 2021 – Statistical tables. Bureau of Justice Statistics.
But elevated rates of jail incarceration persist, as do sharp disparities for Black Americans and American Indians compared to whites. This can also be seen best by examining the cumulative lifetime risk of jail incarceration, which is far higher than for prisons since jail incarceration is far more common than imprisonment. A study of New York City, which has dramatically reduced its jail incarceration rate, found that 27% of Black men and 16% of Latinx men, in contrast to only 3% of white men, had been in jail by age 38 in 2017. Excessively high jail incarceration levels nationwide are especially problematic given that three-quarters of people in jails are unconvicted—being detained prior to the resolution of their case—and research shows that diverting many people charged with misdemeanor crimes away from jail sentences improves public safety outcomes.
Community Supervision
The population serving community supervision sentences—probation and parole—has also contracted, reaching 3.7 million in 2021, down from a peak of 5.1 million in 2007. The downsizing of this population for whites—a 16% reduction between 2011 and 2021—has been matched or outpaced by all other racial and ethnic groups, except for American Indians, whose population under community supervision has increased 4% during this period.
While community supervision levels have declined for most racial and ethnic groups, for many of the 3.7 million people on supervision, this sanction serves as a “trip wire for further criminal legal system contact” and is a cause for disenfranchisement in many states. In 2021, people of color comprised 62% of the population serving a probation or parole sentence, although they comprised 41% of the U.S. population.
Youth Incarceration
Youth decarceration has been especially dramatic, and racial and ethnic disparities have declined among this population as well. The number of youth held in juvenile justice facilities fell by 77%—from 109,000 in 2000 to 25,000 in 2020. In 2019, Black youth were 4.4 times as likely to be incarcerated in the juvenile justice system as their white peers. This is a decline from the peak level of disparity in 2015, when Black youth were 5.0 times as likely as white youth to be incarcerated. In 2019, Latinx youth were 1.3 times as likely as white youth to be held in juvenile facilities, a decline from a peak level of 2.4 times in 1997. American Indian youth, however, were at their peak level of disparity in 2019, having been 3.3 times as likely to be incarcerated as white youth, a level of disparity also reached in 2013. In addition to tackling the lingering disparities in youth incarceration, there is need for further decarceration of all youth given evidence that incarceration is often not necessary or effective for youth and well designed alternative-to-incarceration programs produce better public safety outcomes than incarceration.


