
Over the past quarter century, there has been a profound change in the involvement of women within the criminal legal system. This is the result of more expansive law enforcement efforts, stiffer drug sentencing laws, and post-conviction barriers to reentry that uniquely affect women. The female incarcerated population stands almost seven times higher than in 1980. Over sixty percent (62%) of imprisoned women in state prisons have a child under the age of 18.
Between 1980 and 2022, the number of incarcerated women increased by more than 585%, rising from a total of 26,326 in 1980 to 180,684 in 2022. While 2020 saw a substantial downsizing due to the COVID-19 pandemic, this trend reversed with an 18% increase in 2022.
Rise in Women’s Incarceration, 1980-2022
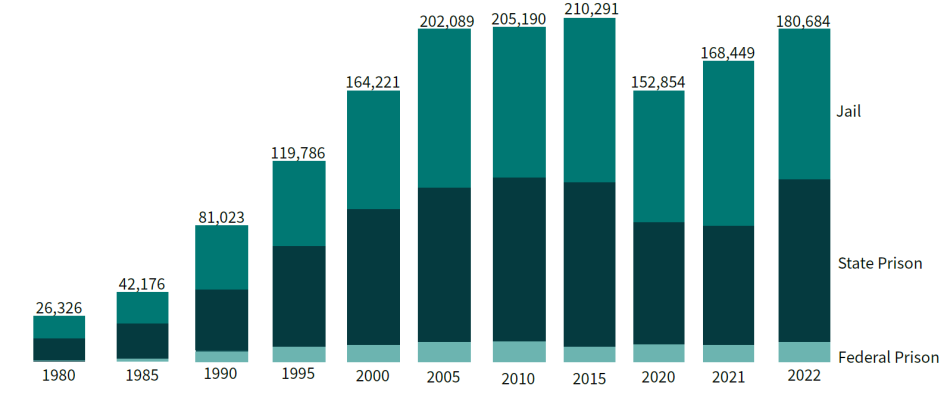
Sources: Historical Corrections Statistics in the United States 1850-1984 (1986); Prison and Jail Inmates at Midyear Series (1997- 2022), Prisoners Series (1980-2022). Bureau of Justice Statistics.
Though many more men are in prison than women, the rate of growth for female imprisonment has been twice as high as that of men since 1980. There are over 975,000 women under the supervision of the criminal justice system.
Women Under Control of the U.S. Corrections System, 2022
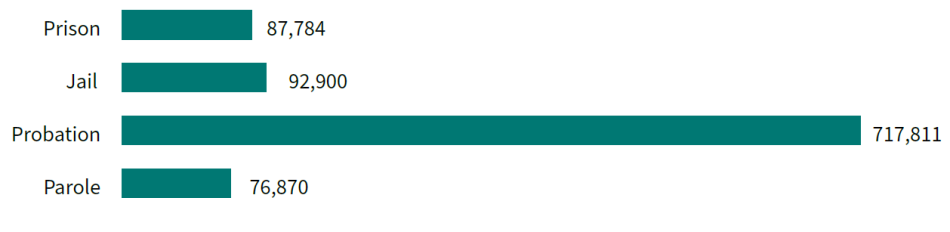
Sources: Carson, E. A., & Kluckow, R. (2023). Prisoners in 2022 – Statistical tables. Bureau of Justice Statistics.; Kaeble, D. (2024). Probation and parole in the United States, 2022. Bureau of Justice Statistics.; Zeng, Z. (2023). Jail inmates in 2022 – Statistical tables. Bureau of Justice Statistics.
Race and Ethnicity in Prisons
- In 2022, the imprisonment rate for Black women (64 per 100,000) was 1.6 times the rate of imprisonment for white women (40 per 100,000).
- Latina women were imprisoned at 1.2 times the rate of white women (49 vs. 40 per 100,000).
- The rate of imprisonment for Black and Latina women has declined since 2000, while the rate of imprisonment for white women has increased.
- Between 2000 and 2022, the rate of imprisonment in state and federal prisons declined by 69% for Black women, while the rate of imprisonment for white women rose by 18%.
Female Imprisonment Rate per 100,000, by Race and Ethnicity, 2000-2022
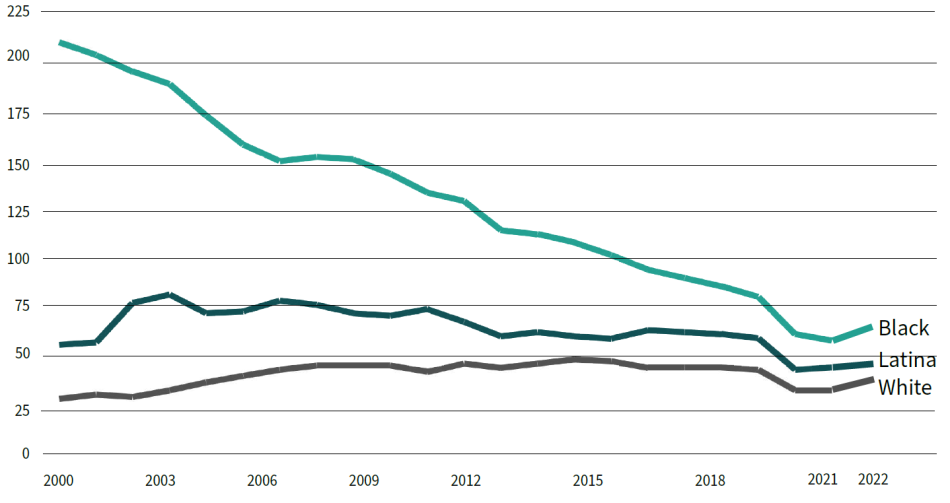
Source: Prisoners Series. Washington, DC: Bureau of Justice Statistics