II. Participation Rate Differences Across Time
In the analyses that follow, we examine how turnout rates and gaps have evolved since 2008. Data of this kind is not available prior to 2008, making that the earliest year for which voter file snapshots can be used on a nationwide scale. While the Obama presidency probably reduced racial turnout gaps early in our study period, our results indicate that the gap has widened ever since 2014, when a nonwhite presidential candidate was not temporarily reducing these disparities.
General Turnout Gap
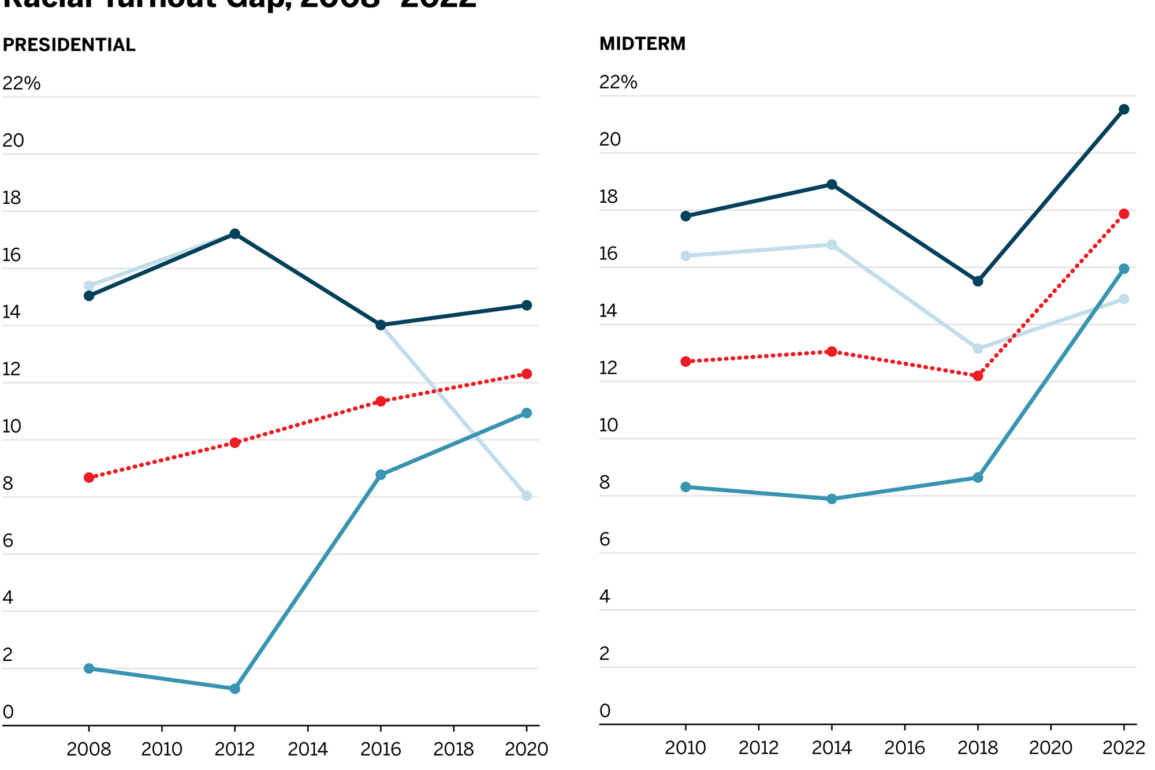
Figure 1 plots the national turnout rates among Asian, Black, Latino, and white voters — the ethnic/racial groups for which BISG provides reliable estimates. As figure 1 makes clear, turnout for white and Black voters in the 2008 and 2012 elections, with Obama at the top of the ticket, reached near parity. While turnout rates for Asian and Latino voters lagged white and Black voters, the overall white–nonwhite turnout gap was narrower during these years than in the decade that followed.
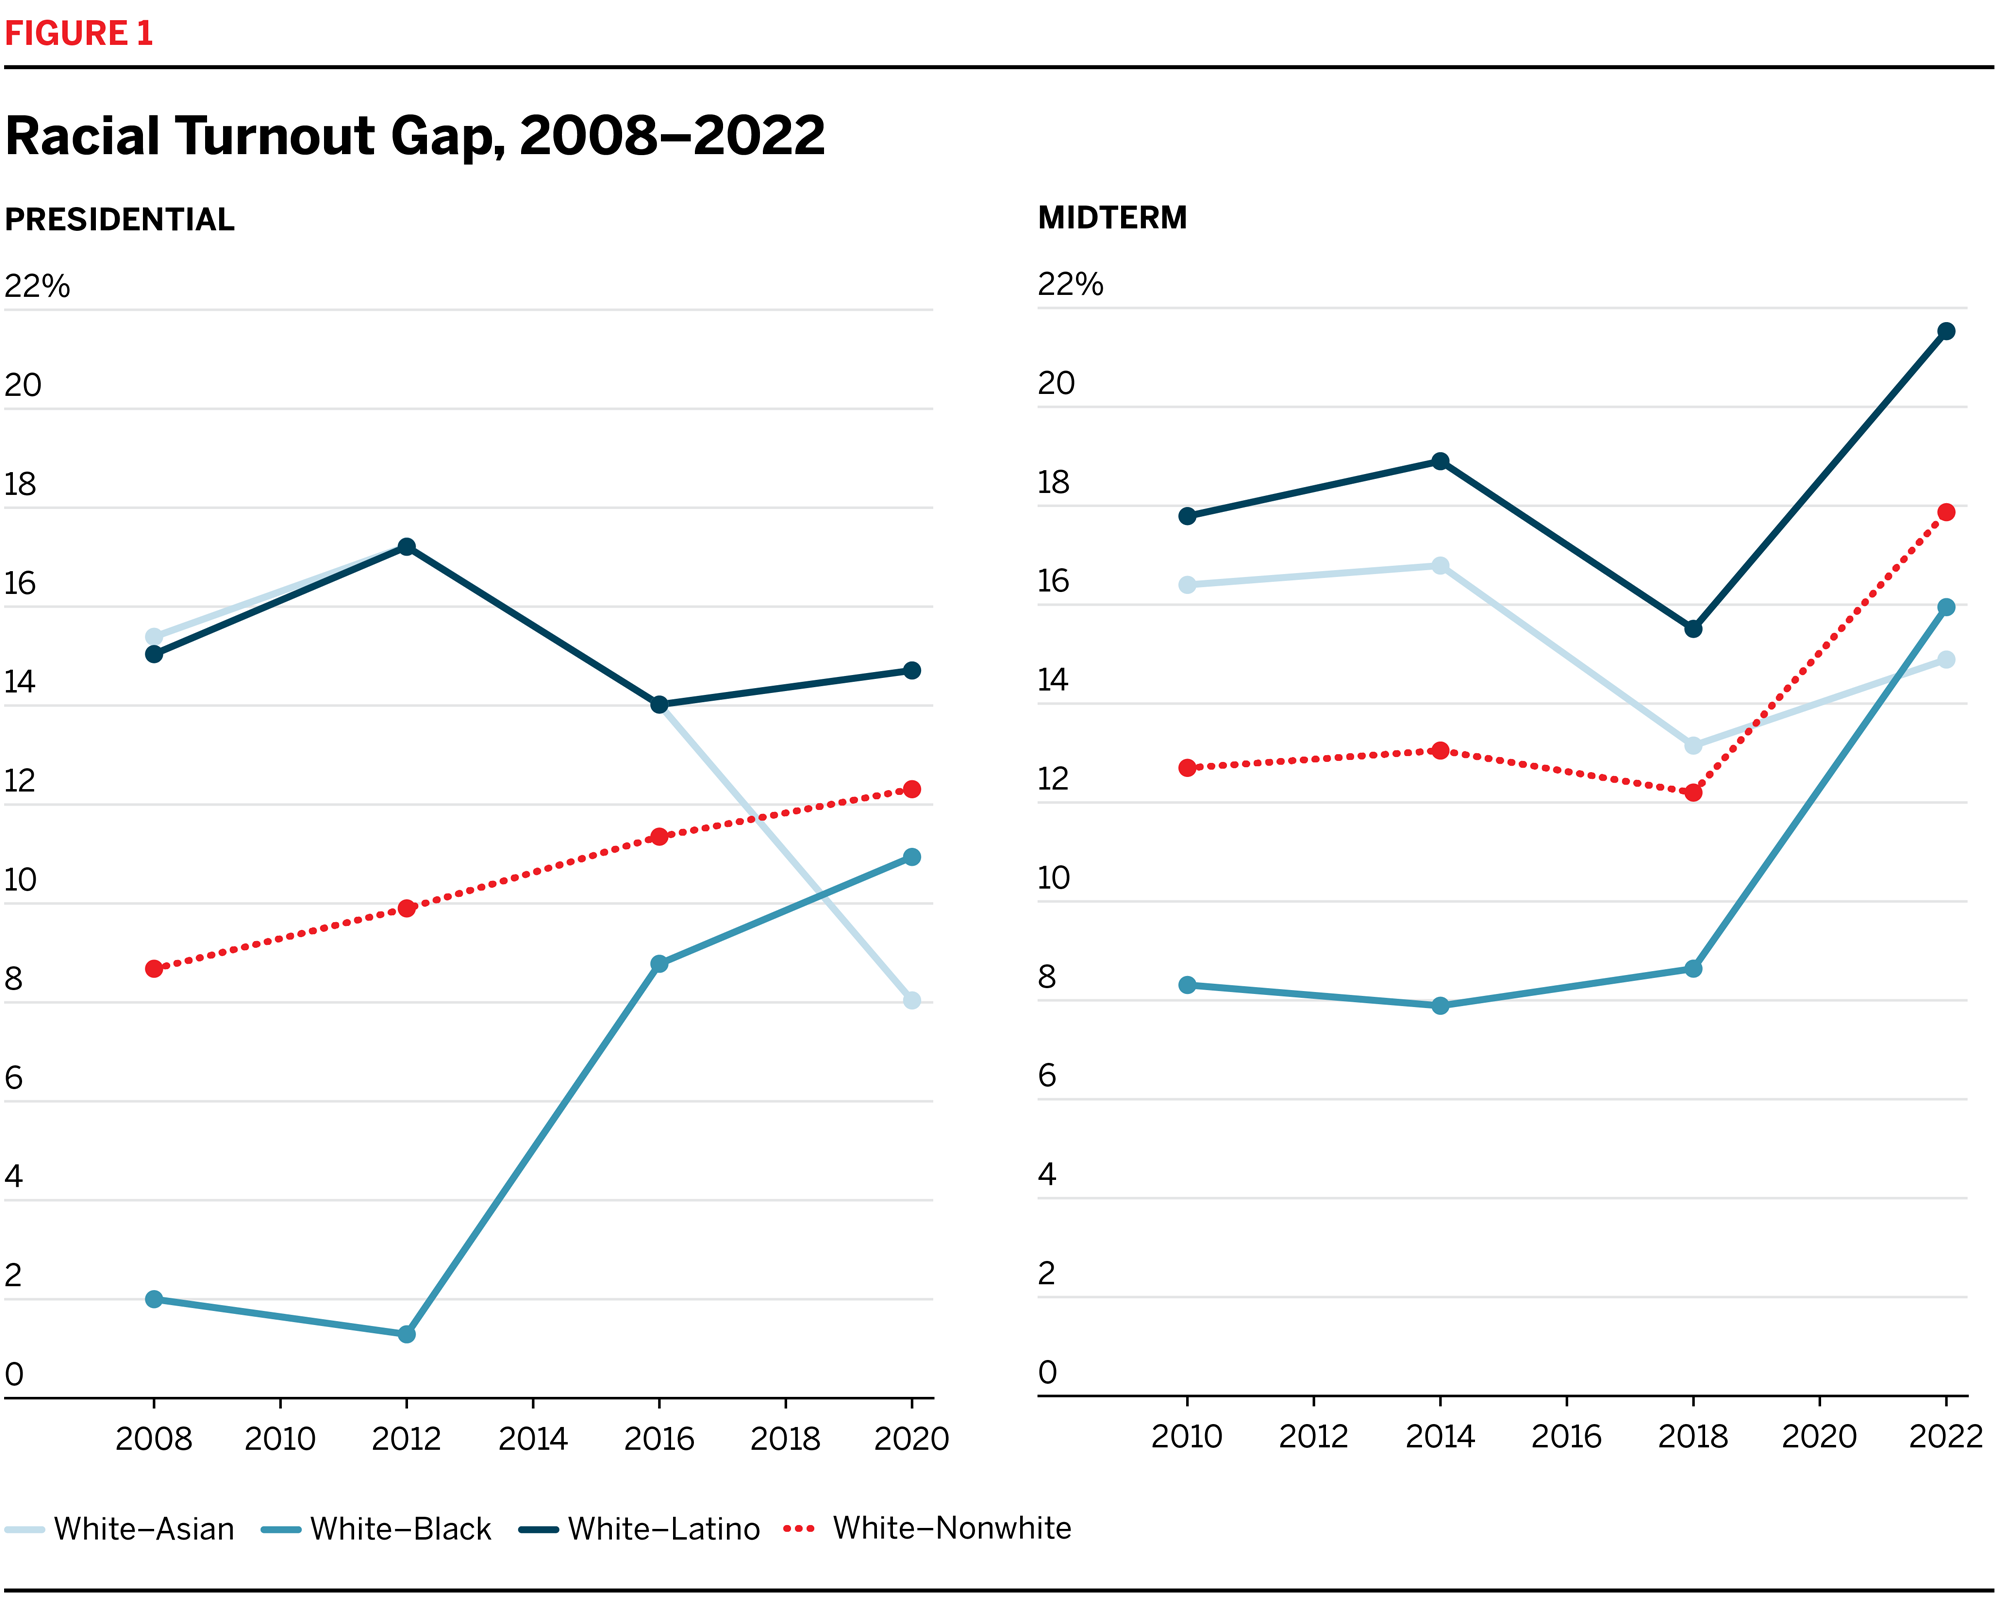
As we discussed above, the majority of the Court in Shelby County pointed to the narrow turnout gaps in the 2008 and 2012 presidential elections to argue against the continued necessity of Section 5 of the Voting Rights Act. Of course, political science research has long established that Black voters participate at higher rates when Black candidates are on the ballot; this, as much as anything else, was the likely explanation for the near parity in those years. Figure 1 makes clear just how narrow the Court’s argument was. In the 2010 election, when Section 5 was still in full force, the white–Black turnout gap was 8 percentage points — four times the size of the gap in 2008. By pointing only to presidential elections with a Black candidate, it focused on elections where factors unrelated to voting rights (temporarily) reduced the racial turnout gap.
While turnout rates have collectively improved since 2012, white turnout has increased the most: from the 2012 to 2020 presidential elections, white turnout rose by 10 percentage points while overall nonwhite turnout went up by less than 8 points. Similarly, from the 2014 to 2022 midterm elections, white turnout rose by 13 points while nonwhite turnout increased by only 8 points. Much of the increase in the gap was concentrated in 2022, perhaps due to the highly contentious round of redistricting leading into that year’s election. All told, the white–nonwhite turnout gap increased from 10 points to 12 points between 2012 and 2020.
The shifts in national turnout rates among different racial groups raise many questions. Black voters, for instance, are generally concentrated in the Northeast and the South, while Latino and Asian communities are larger on the West Coast. Are the differences in racial turnout rates just regional differences? Are voters on the West Coast less likely to participate overall, regardless of their race? Figures 2 and 3 plot the turnout rates for each racial group within each of the country’s broadly defined regions: Northeast, South, Midwest, and West.
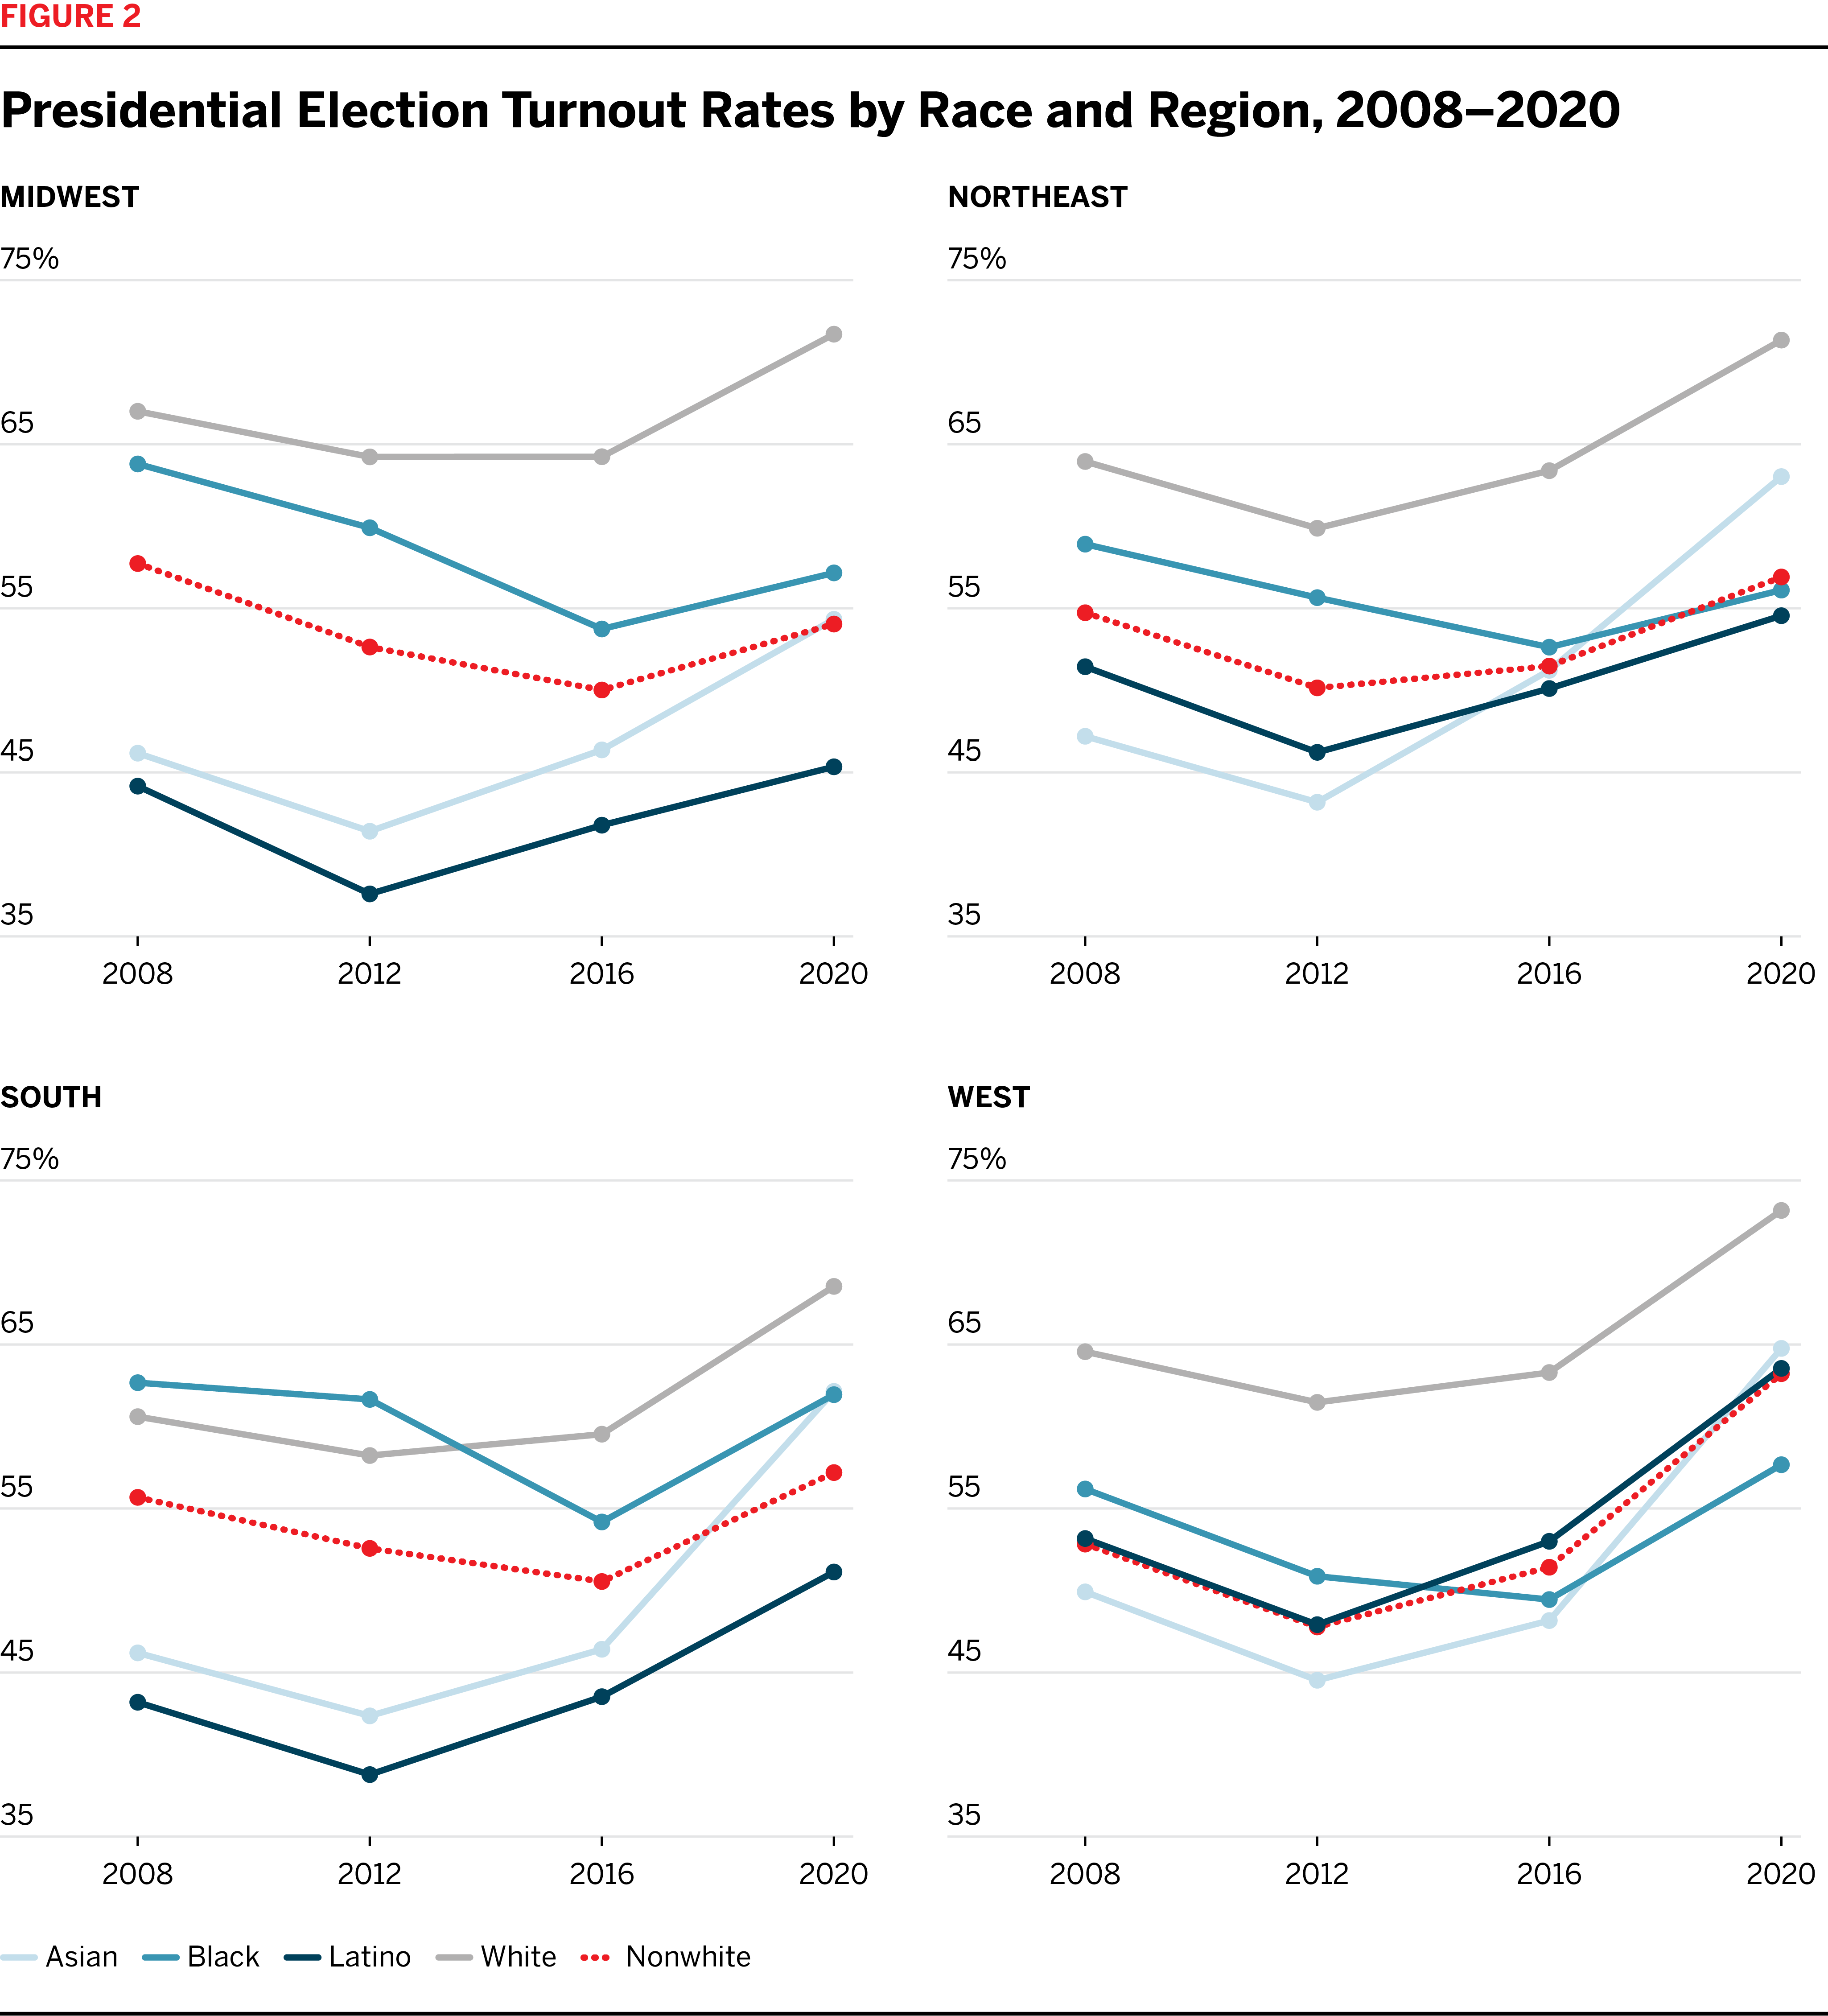
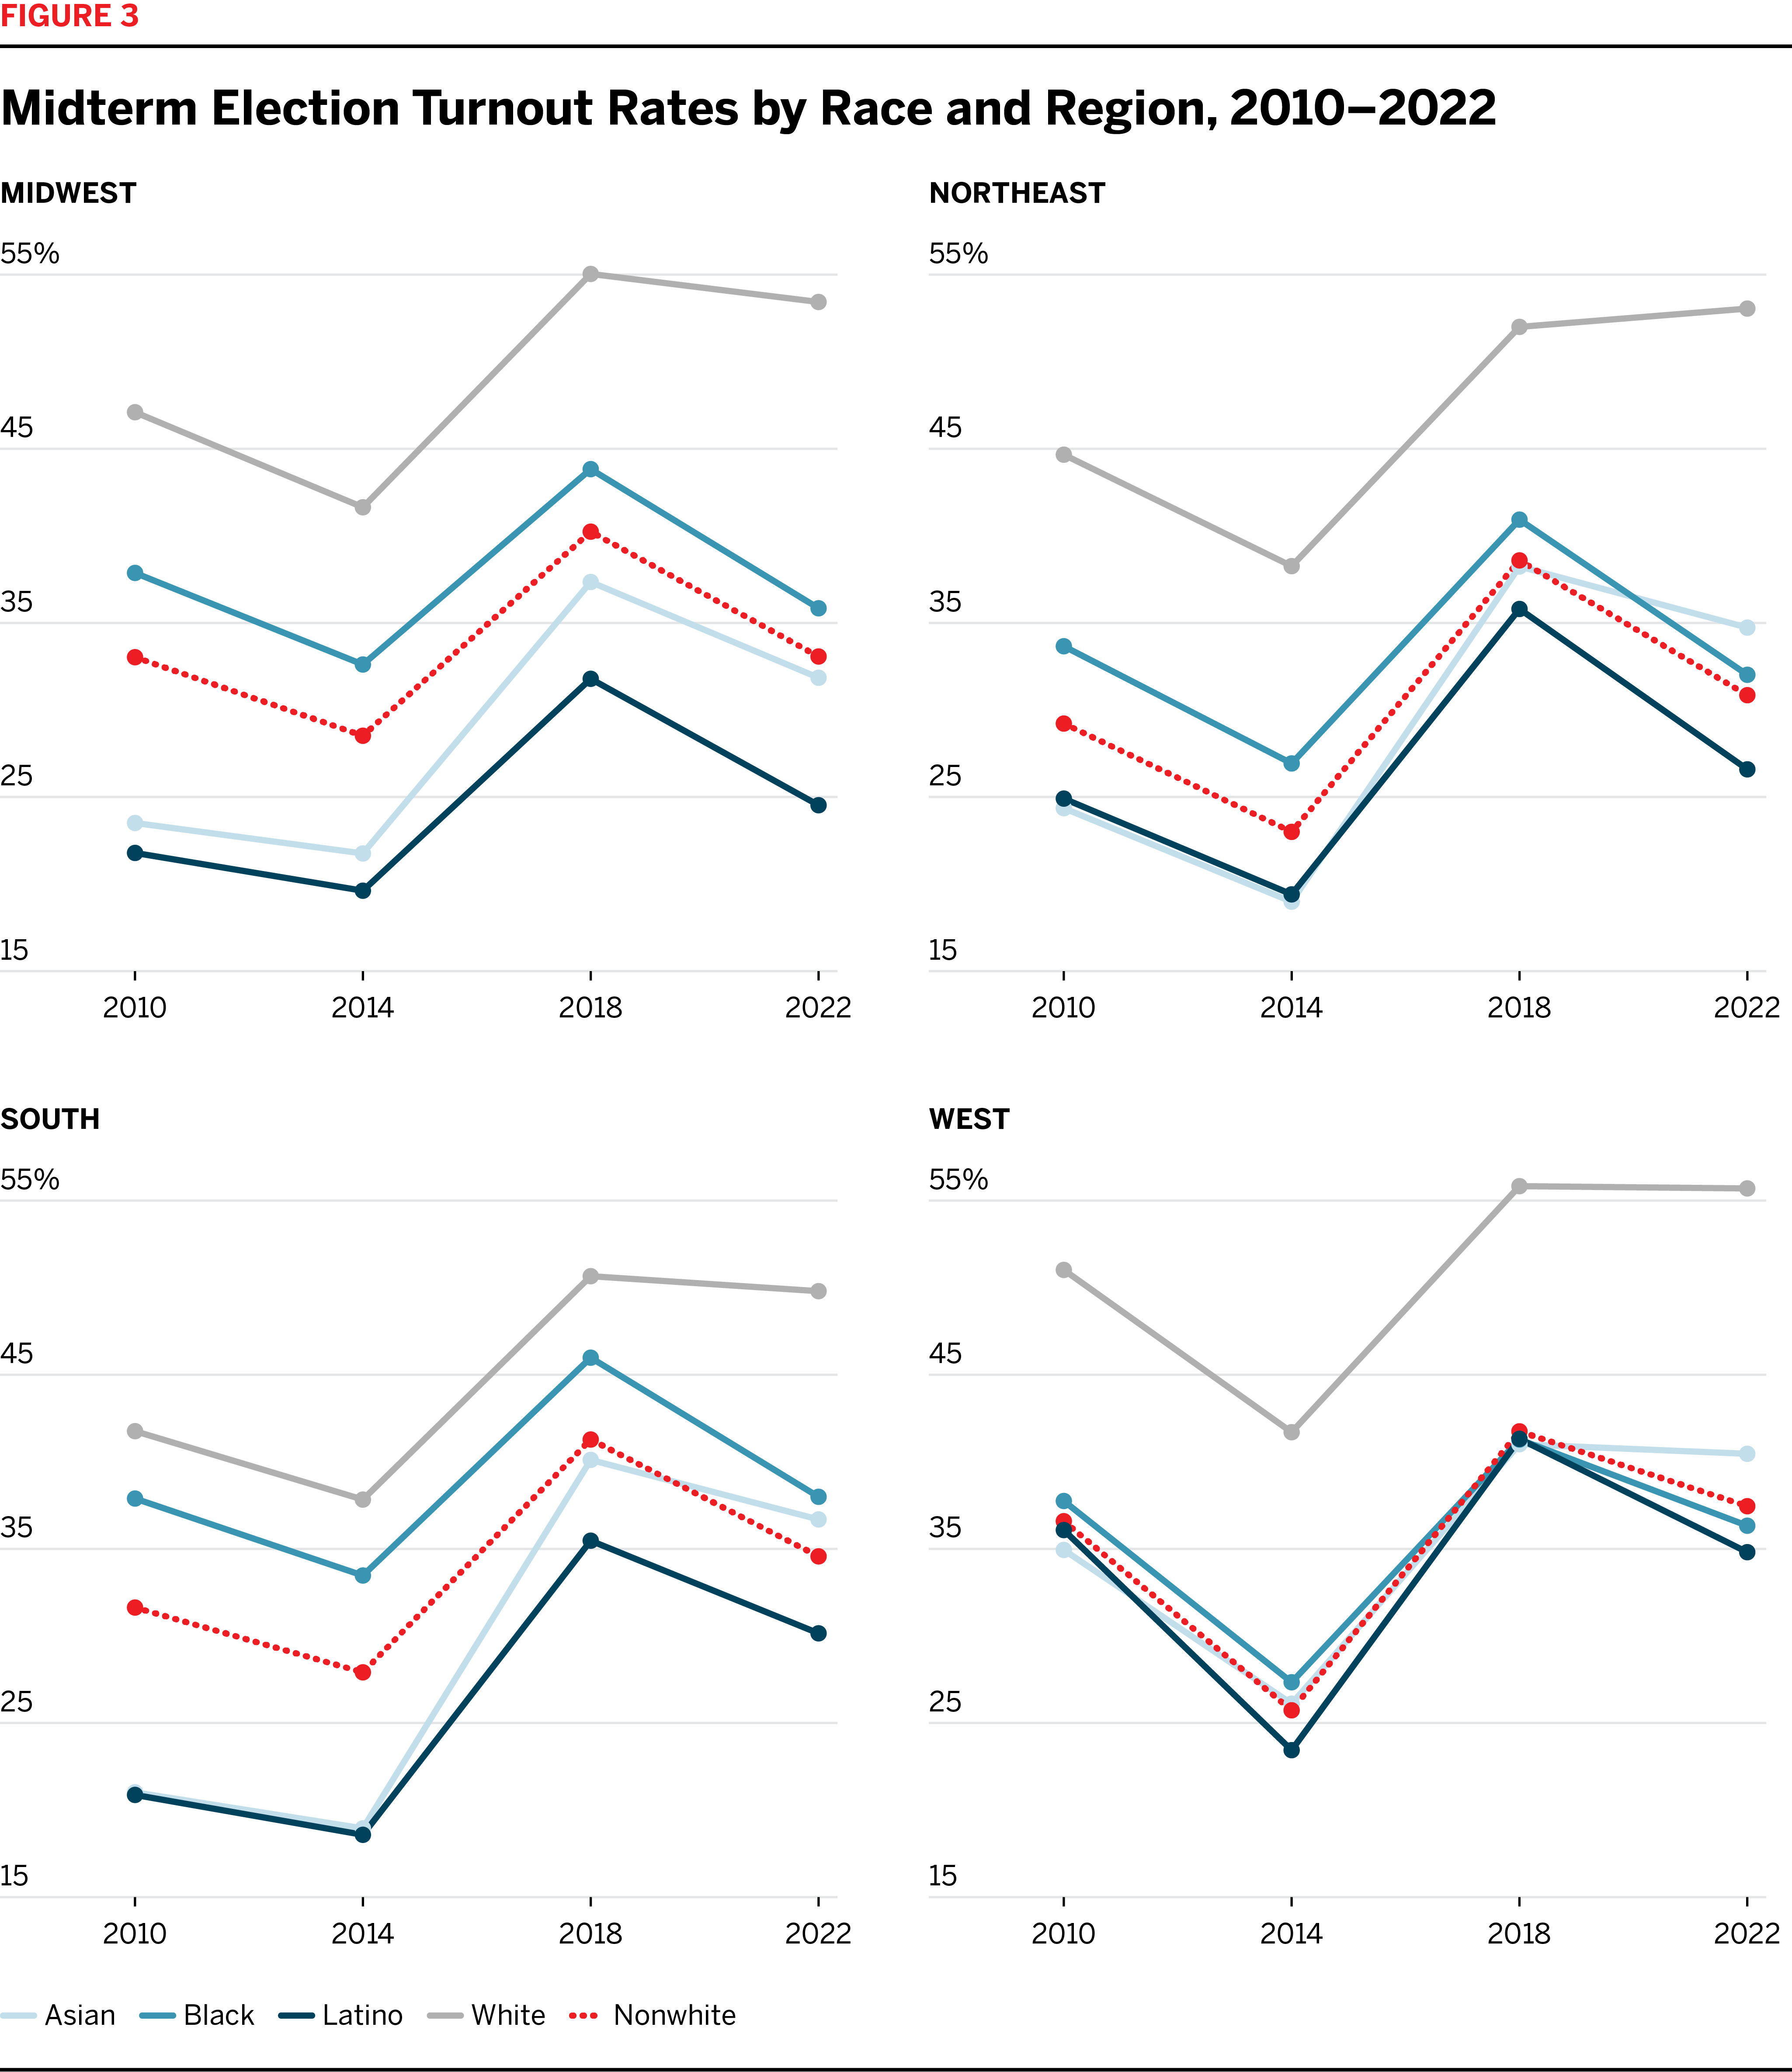
Figures 2 and 3 make clear that most of the racial turnout gap is not explained by regional differences. Within each region, white turnout exceeded that of other groups in every year apart from the 2008 and 2012 elections in the South, where Black turnout slightly exceeded white turnout.
Americans with less education, less money, and fewer resources are less likely to participate in elections. The opportunity cost of participating can be higher for Americans with fewer resources. Traveling to a polling place, for instance, is harder for people without access to a car; the time cost might be compounded for an individual required to take unpaid time off work to vote. Further, individuals juggling multiple jobs or child-care responsibilities, or who face other demands on their time, might forget to register to vote prior to the deadline. Policies that make it more difficult to vote fall hardest on the people with the fewest resources to dedicate to voting.
Economically disadvantaged voters might also abstain from participating because of alienation from government and a political system that in many ways fails to reflect their policy preferences. Regressive policies, such as campaign finance rules that favor wealthy donors and corporate entities or aggressive partisan gerrymandering, send messages to voters that politicians do not care about their needs. As Soss and Jacobs observe, policies that do not address voters’ pressing challenges can “foster atomized publics with little sense of what they have in common and at stake in politics and government.” The same is true when voters think of the government as something that happens to, and not with, them. In some communities, for example, a constant and aggressive police presence teaches citizens that government is something imposed on them, not something that they can control.
As a result of centuries of racially discriminatory policymaking, including when only white people were permitted by law to vote or make policy, racial and ethnic minorities are over-represented in populations where economic and other social precarities are common. Given that social disadvantages can undermine democratic participation, do socioeconomic factors explain the racial turnout gap? They do explain some of it: turnout in the bottom income quartile in 2022 was 32 percent, compared with 58 percent in the top income quartile. The bottom quartile was also considerably less white (the CVAP was 53 percent white compared with 72 percent white in the top quartile). But we find that there are turnout gaps between racial groups living in socioeconomically similar neighborhoods, which indicates that these characteristics can’t entirely explain such gaps.
While the voter file does not include information about voters’ economic status or education, ACS five-year estimates from the Census Bureau reveal the income and education characteristics of the neighborhoods in which they live. We break out turnout gaps by census tract in figures 4 and 5 to test whether neighborhood characteristics influence turnout. We first plot the turnout gap for different races in neighborhoods based on the median household income, with the first quartile being the lowest-income neighborhoods and the fourth quartile being the highest.
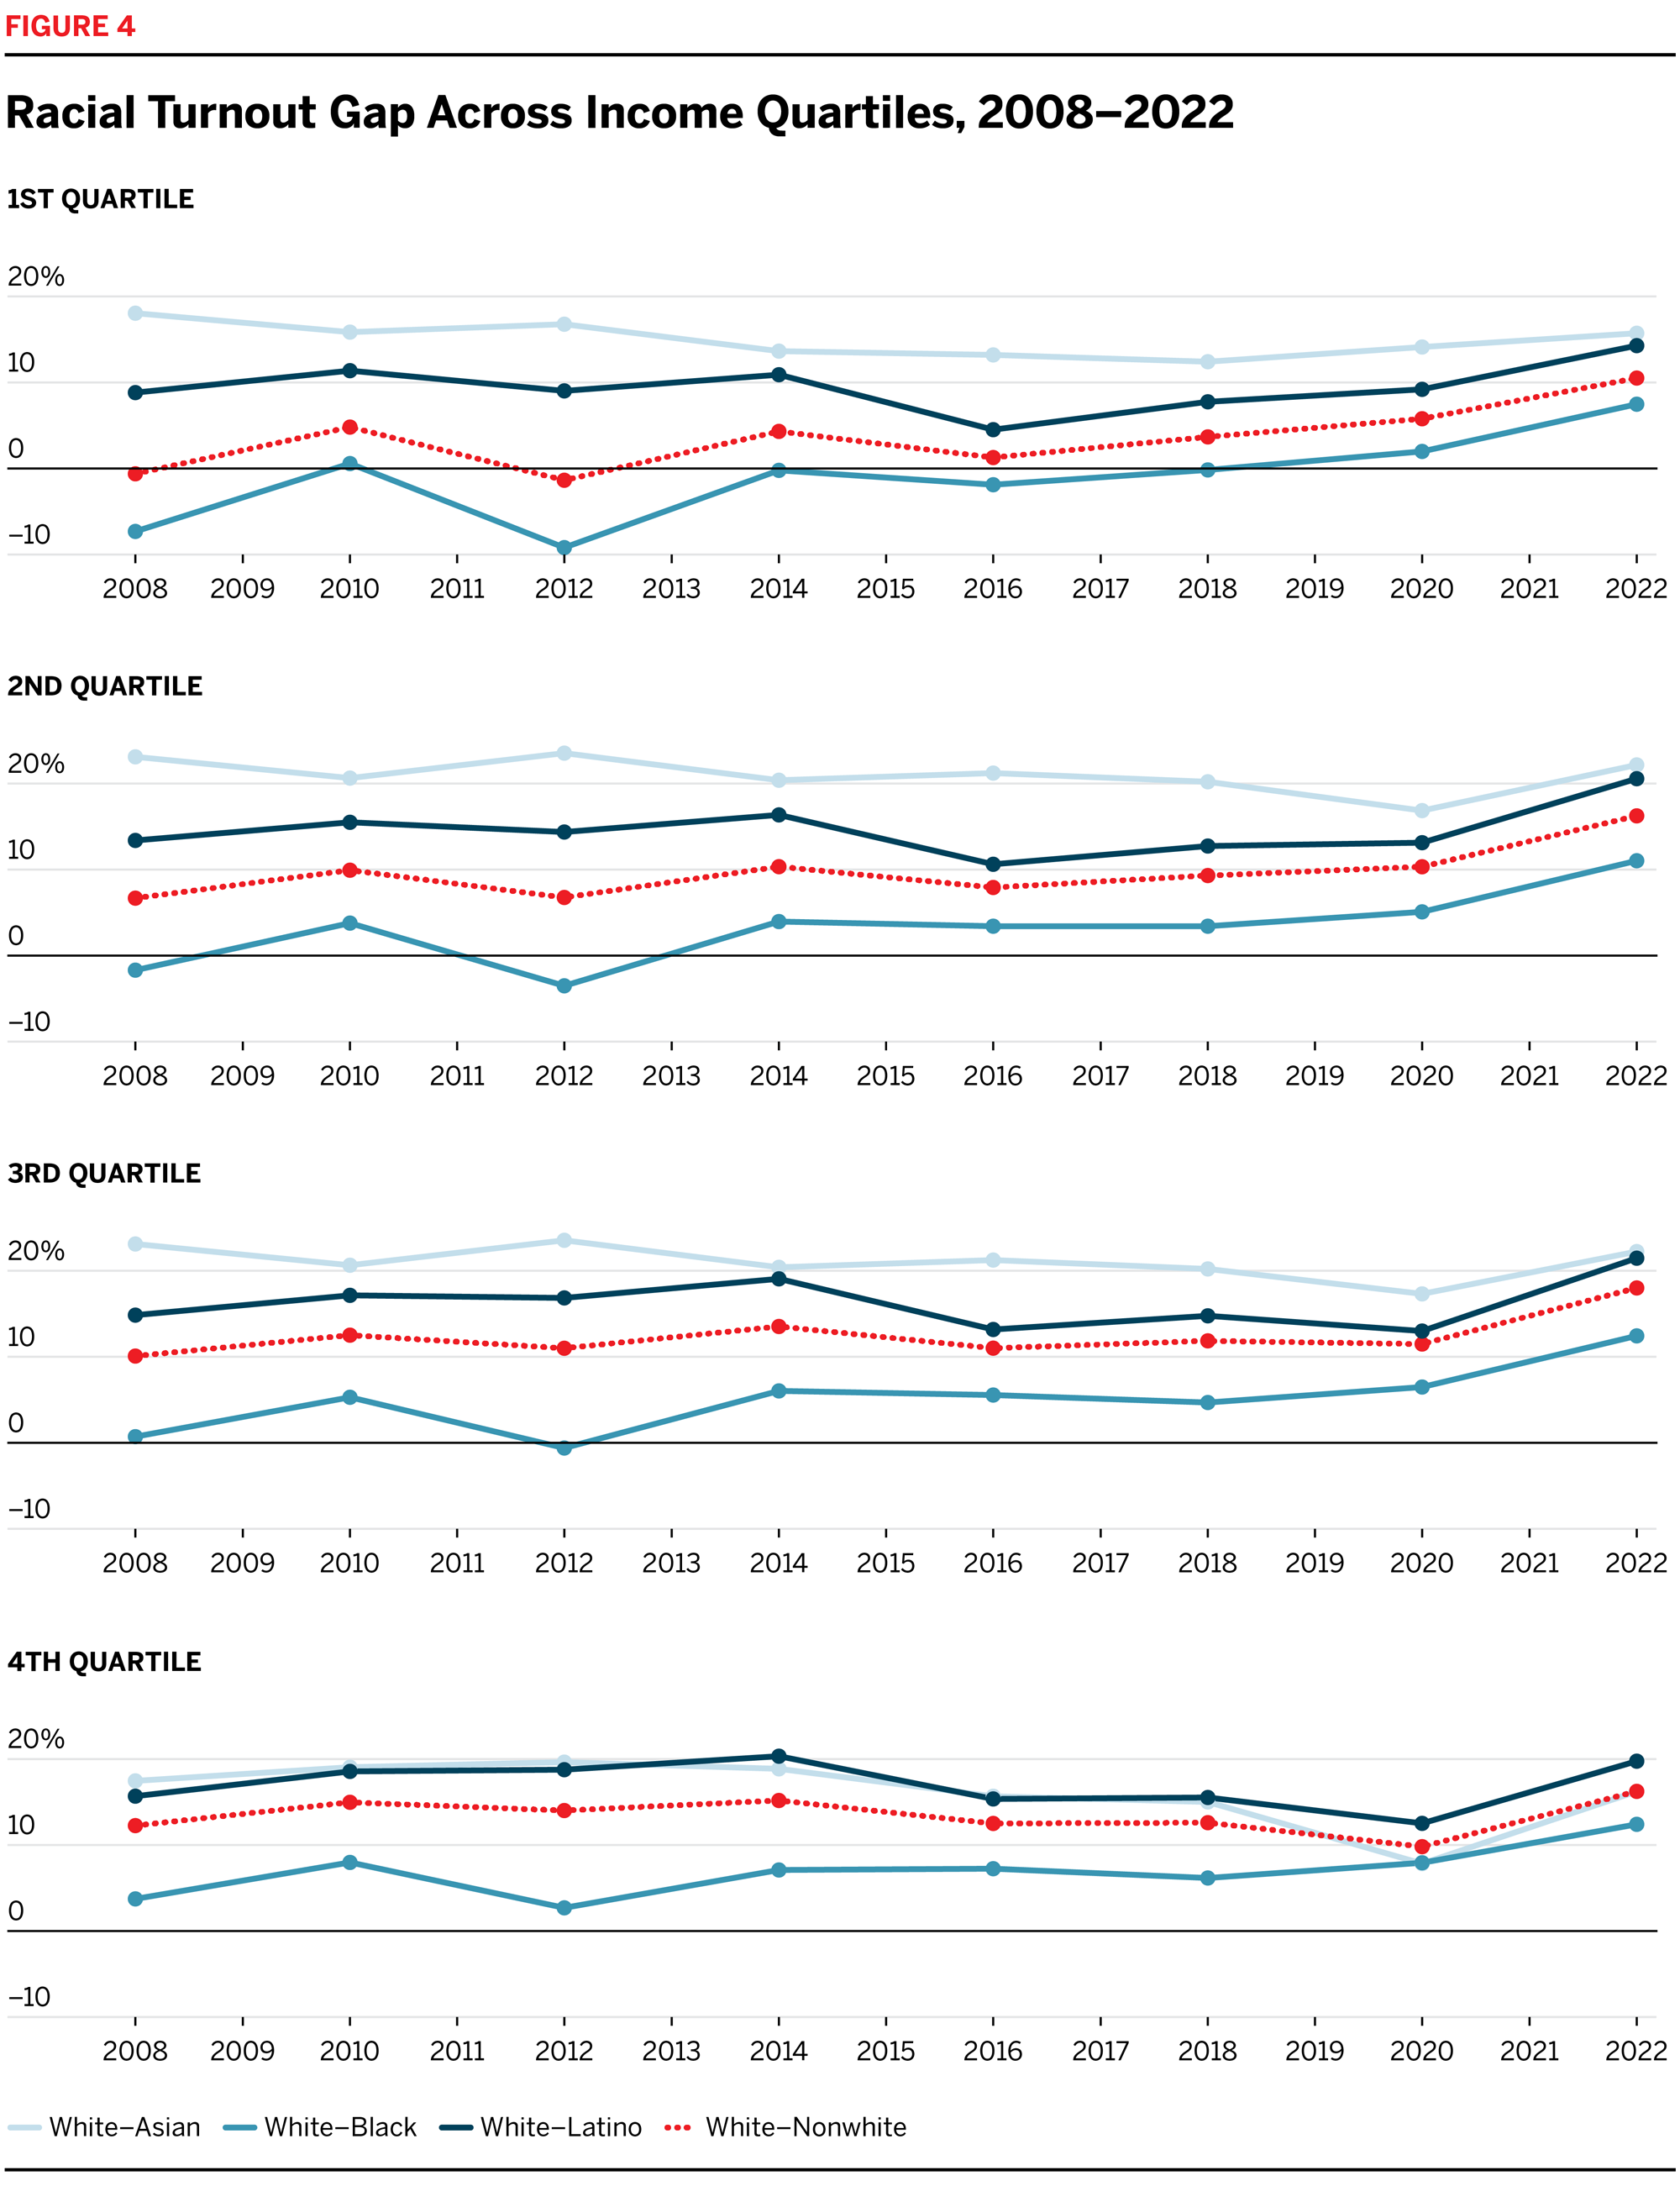
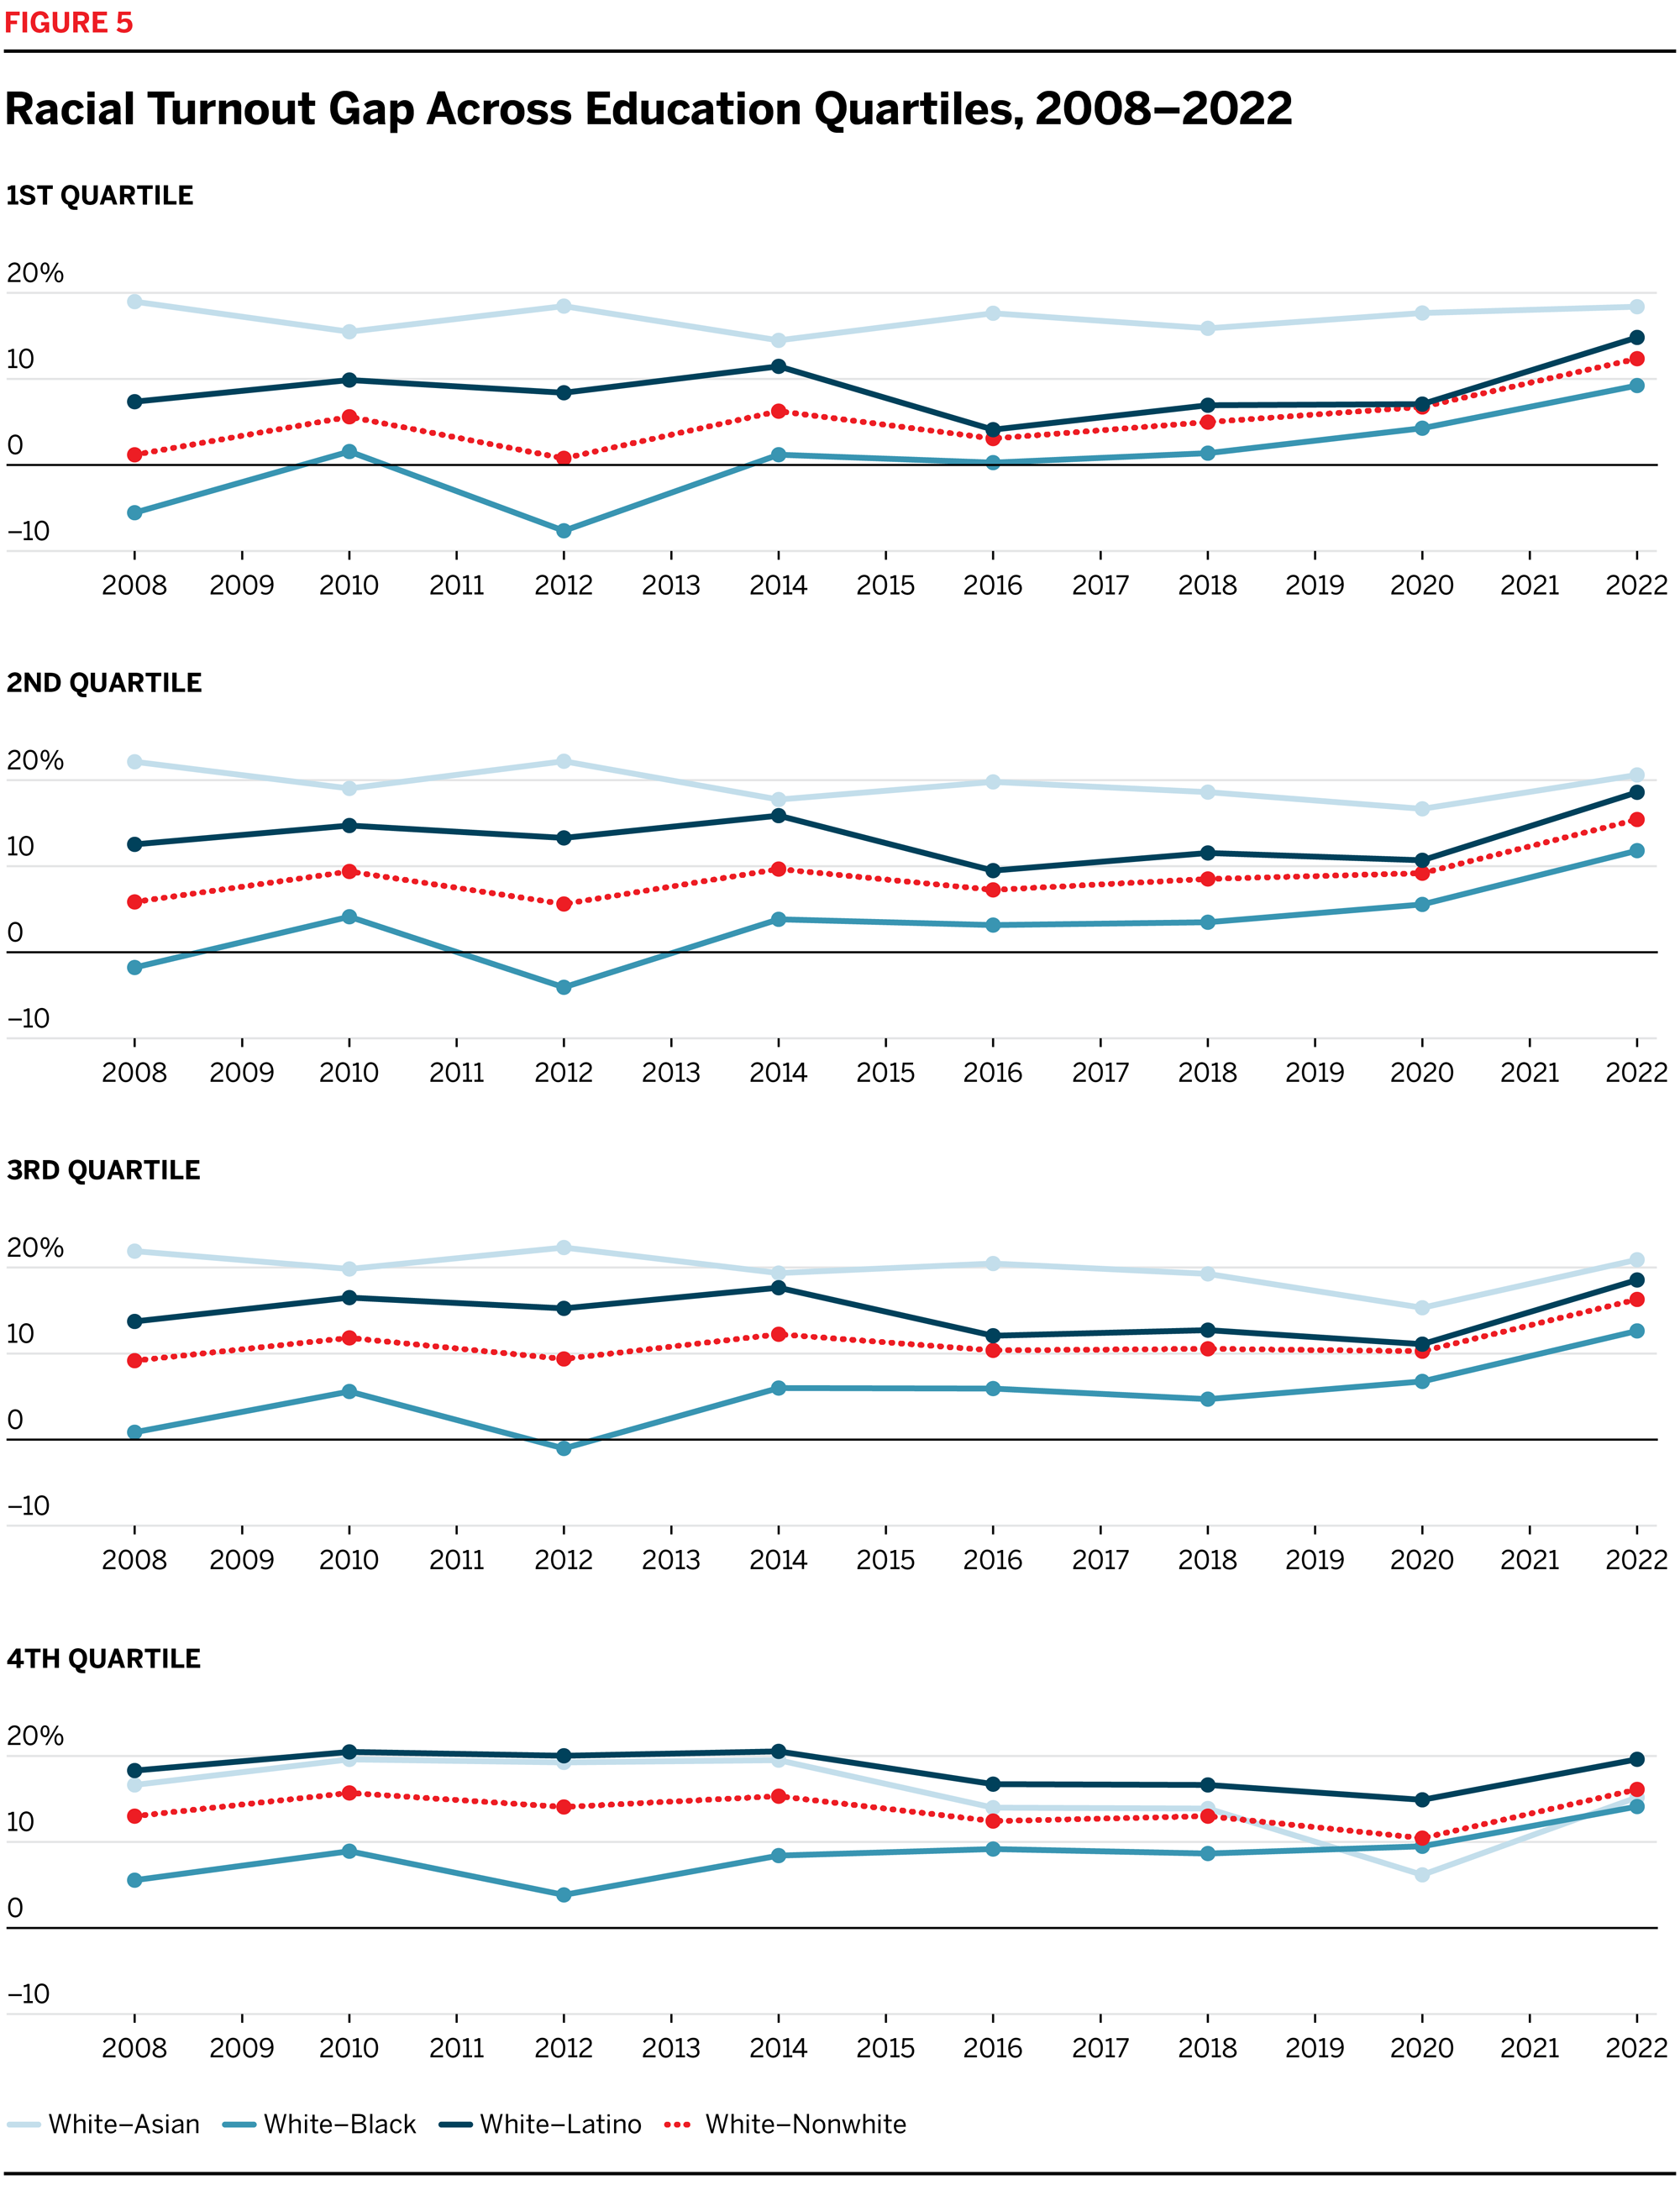
Figure 4 makes immediately clear that the turnout gap is not driven simply by the fact that voters of color live in lower-income neighborhoods: a persistent turnout gap has grown steadily in each income quartile over the past decade. Outside the highest-income areas, the white–Black turnout gap closed prior to 2014, though it has subsequently grown. While white–nonwhite turnout rates approached parity in the early parts of the past decade among voters living in low-income neighborhoods, the same is not true in high-income neighborhoods, which have consistently had the largest turnout gaps. The white–nonwhite turnout gap exceeded 15 percentage points in 2022’s midterm election among voters living in the highest-income parts of the country.
The trends in the white–Asian turnout gap, broken out by income, tell a different story. As figure 1 shows, the overall white–Asian turnout gap narrowed from 14 points in 2016 to just 8 points in 2020. Figure 4 shows, however, that increased participation rates were largely concentrated among Asian voters living in high-income neighborhoods. For Asian Americans living in the lowest-income neighborhoods, the gap grew between 2016 and 2020.
Neighborhood estimates of education level similarly cannot fully explain the turnout gap, as seen in figure 5. When we split tracts into quartiles based on the proportion of the adult population that has at least a bachelor’s degree, turnout gaps remain for all groups. Similar to the trends across income level, the white–nonwhite turnout gap is largest among voters living in the highest-educated neighborhoods. And, while the gaps may be smaller in lower-education neighborhoods, those are also the neighborhoods where the gap is growing most rapidly. Further, reductions in the white–Asian turnout gap are almost entirely concentrated among voters in the highest-educated neighborhoods. While the white–Asian gap is substantially larger than that of other racial and ethnic groups among voters living in all but the most educated areas, it has consistently been close to or smaller than the white–Latino gap in high-education neighborhoods.
Weighted Turnout Gaps
Figure 6 shows how the turnout gap impacted statewide turnout in the 2020 presidential (left-hand panel) and 2022 midterm (right-hand panel) elections. We break states out according to whether they were entirely, partially, or not covered by the preclearance condition of the Voting Rights Act prior to Shelby County. Nationally, turnout would have been 4 percentage points higher in 2020 and 6 percentage points higher in 2022 if nonwhite voters had participated at the same rate as white voters. These figures are particularly striking considering that turnout in these elections was at near-record highs; in fact, turnout in 2020 was the highest in at least a century. And yet, had voters of color participated at the same rates as white voters in 2020, 9.3 million more ballots would have been cast, and in 2022 that figure would have been 13.9 million. White turnout exceeded nonwhite turnout in every single state except Hawaii in 2022.
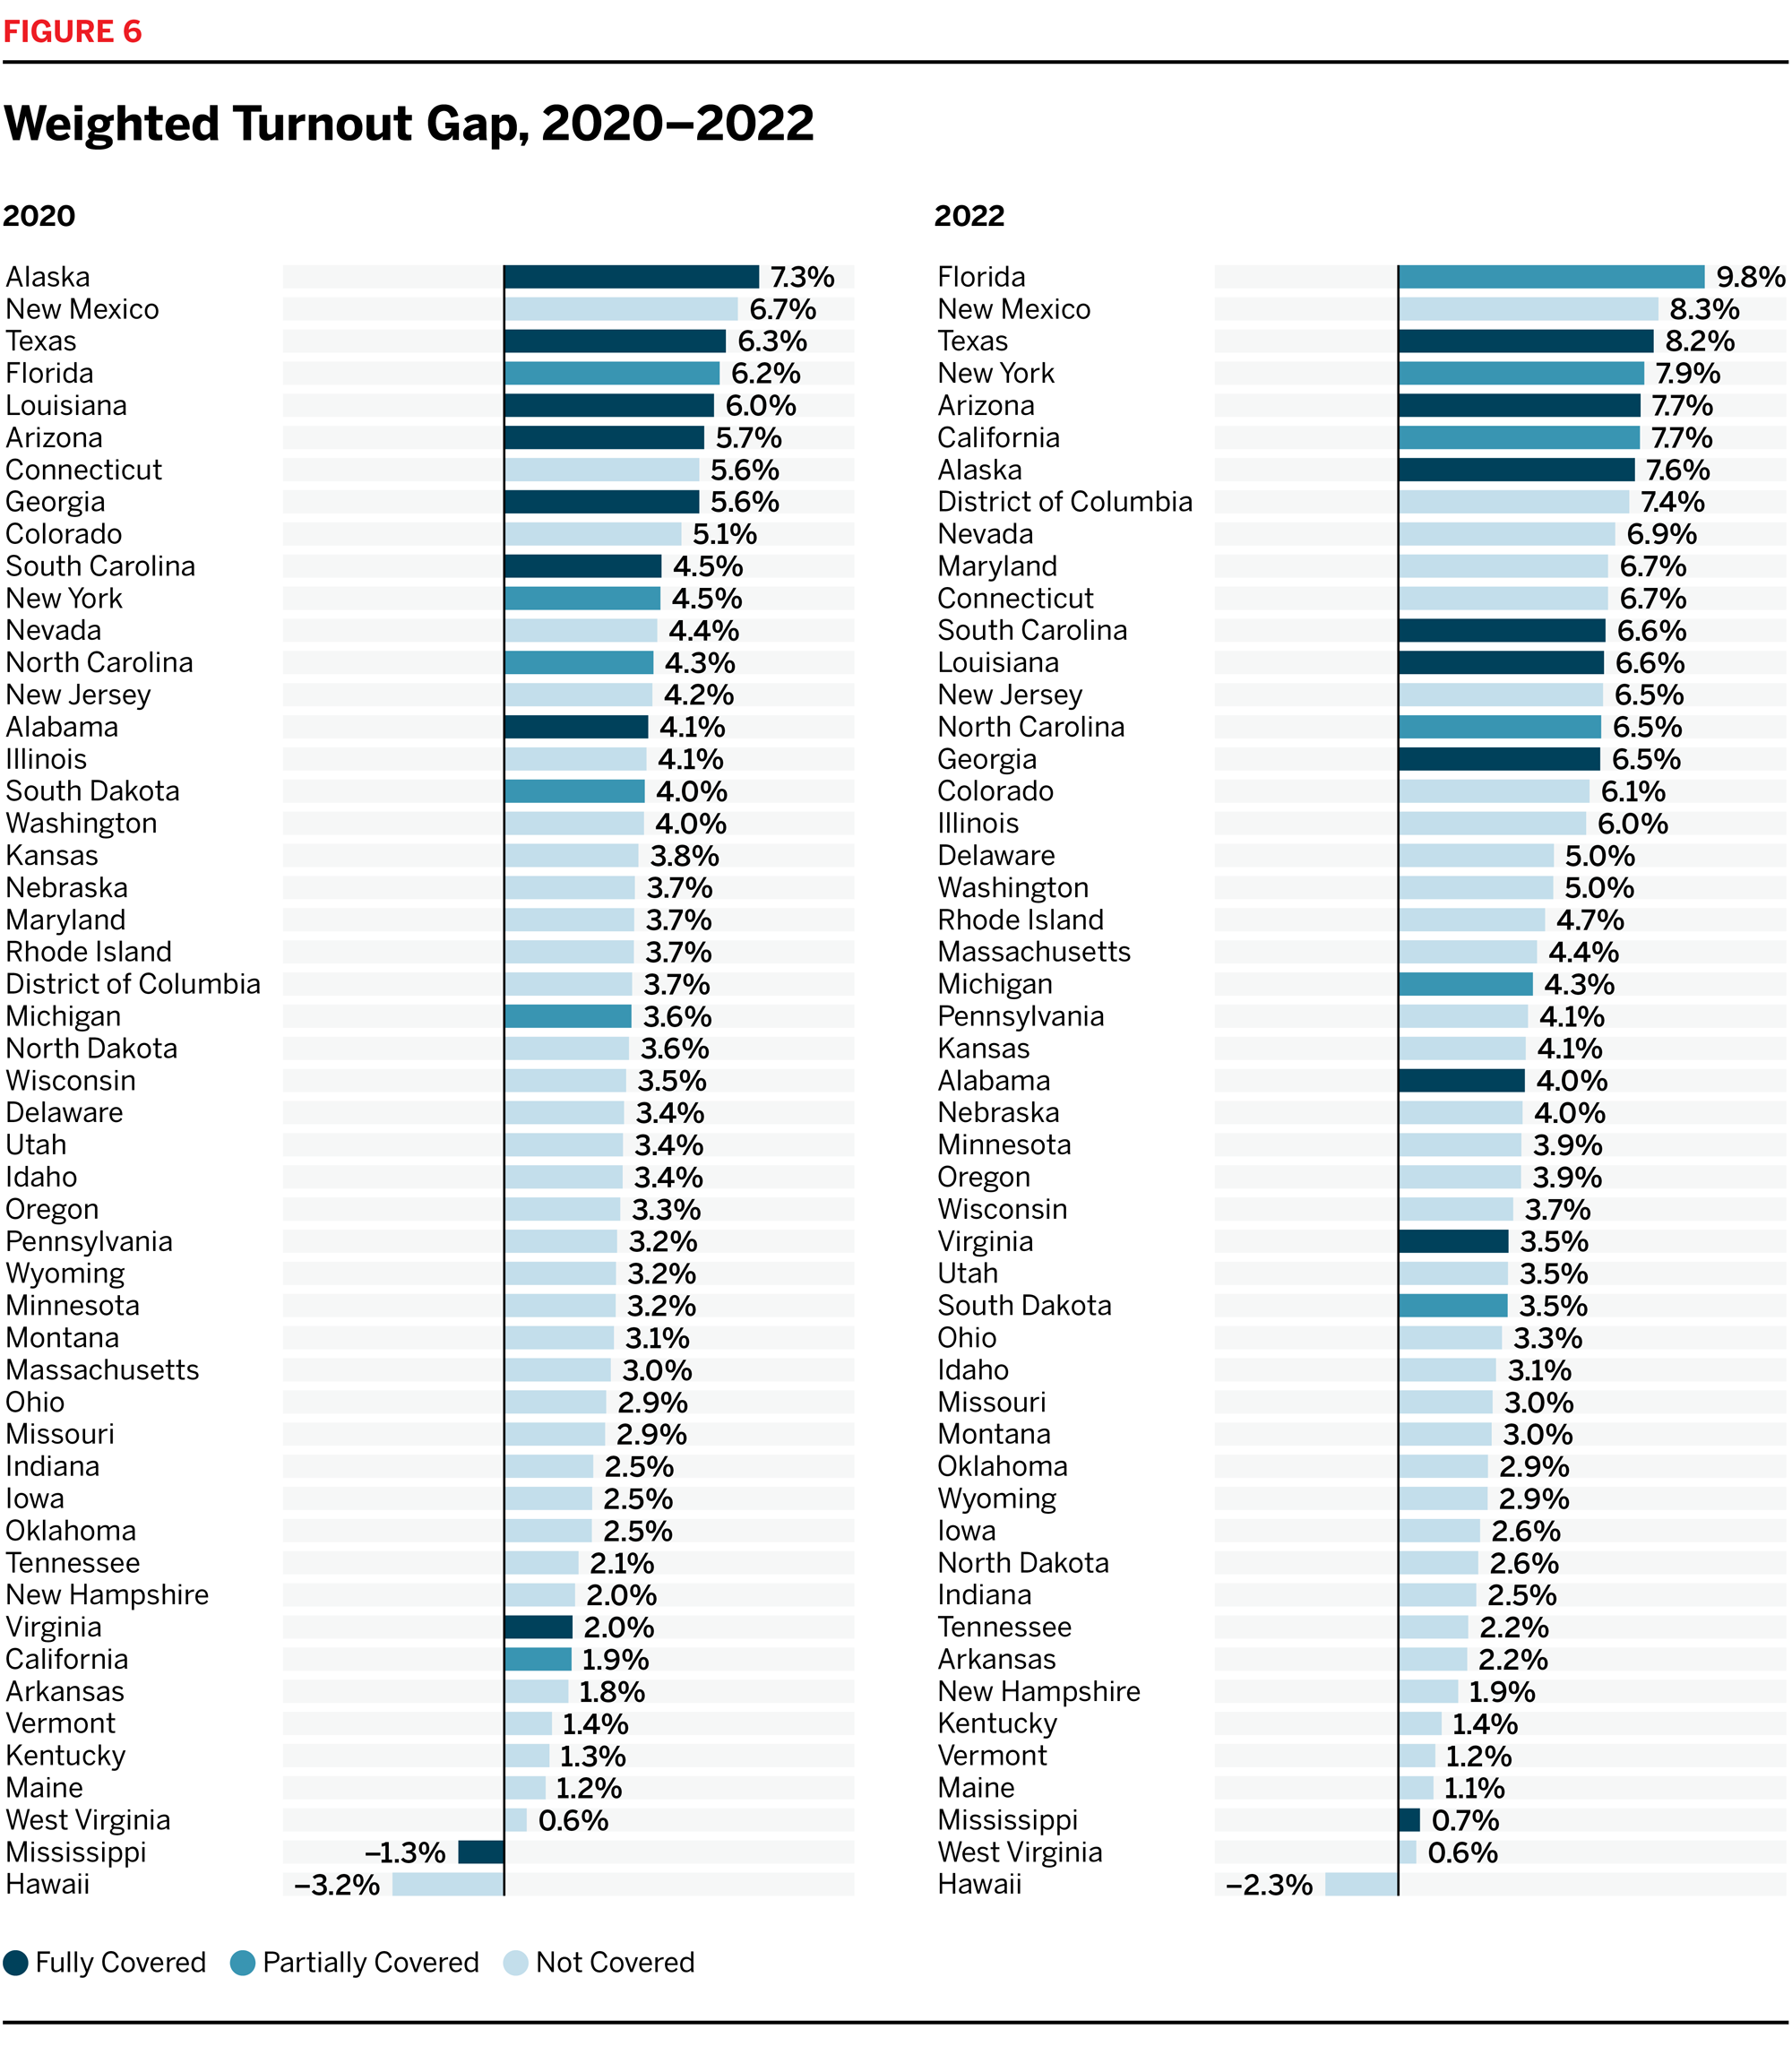
Figure 6 indicates that the weighted turnout gap was not uniformly distributed across states. It was largest in Alaska in 2020 and Florida in 2022. New Mexico and Texas had the second- and third-largest gap in both elections. These states are home to large nonwhite populations, so their presence at the top is unsurprising given that the relative size of the nonwhite population directly contributes to the influence of the racial turnout gap on overall participation rates. Another striking feature of this figure, however, is the concentration of high weighted gaps in states in the West; generally speaking, the impact of the racial turnout gap on statewide turnout was larger in states where Latinos make up a large share of the nonwhite population. This corresponds with results presented in the previous section: although Latino turnout rates were not markedly different in different regions, Latinos make up a larger share of the population in the West, exerting a larger influence on statewide turnout in those states.
Figure 6 also makes clear just how distinct the states formerly covered by Section 5 of the Voting Rights Act remain. The formerly covered states have large nonwhite populations and large turnout gaps, leading to some of the largest statewide turnout distortions in the nation. Put differently, a decade after Shelby County, the turnout gap continues to have a disproportionate impact in precisely the parts of the country that were once covered due to their histories of racially discriminatory voting practices.
Figures 7 and 8 break down the weighted turnout gaps in 2020 and 2022, respectively, based on which group formed the largest nonwhite racial or ethnic group in the state. The weighted gap is consistently highest in states where Latinos were the largest nonwhite group. Once again, the impact of the racial turnout gap on statewide participation rates is highest in the parts of the country that were covered under Section 5 of the Voting Rights Act. (In these charts, “other” includes all states where a group other than Black or Latino Americans is the single largest nonwhite group.)
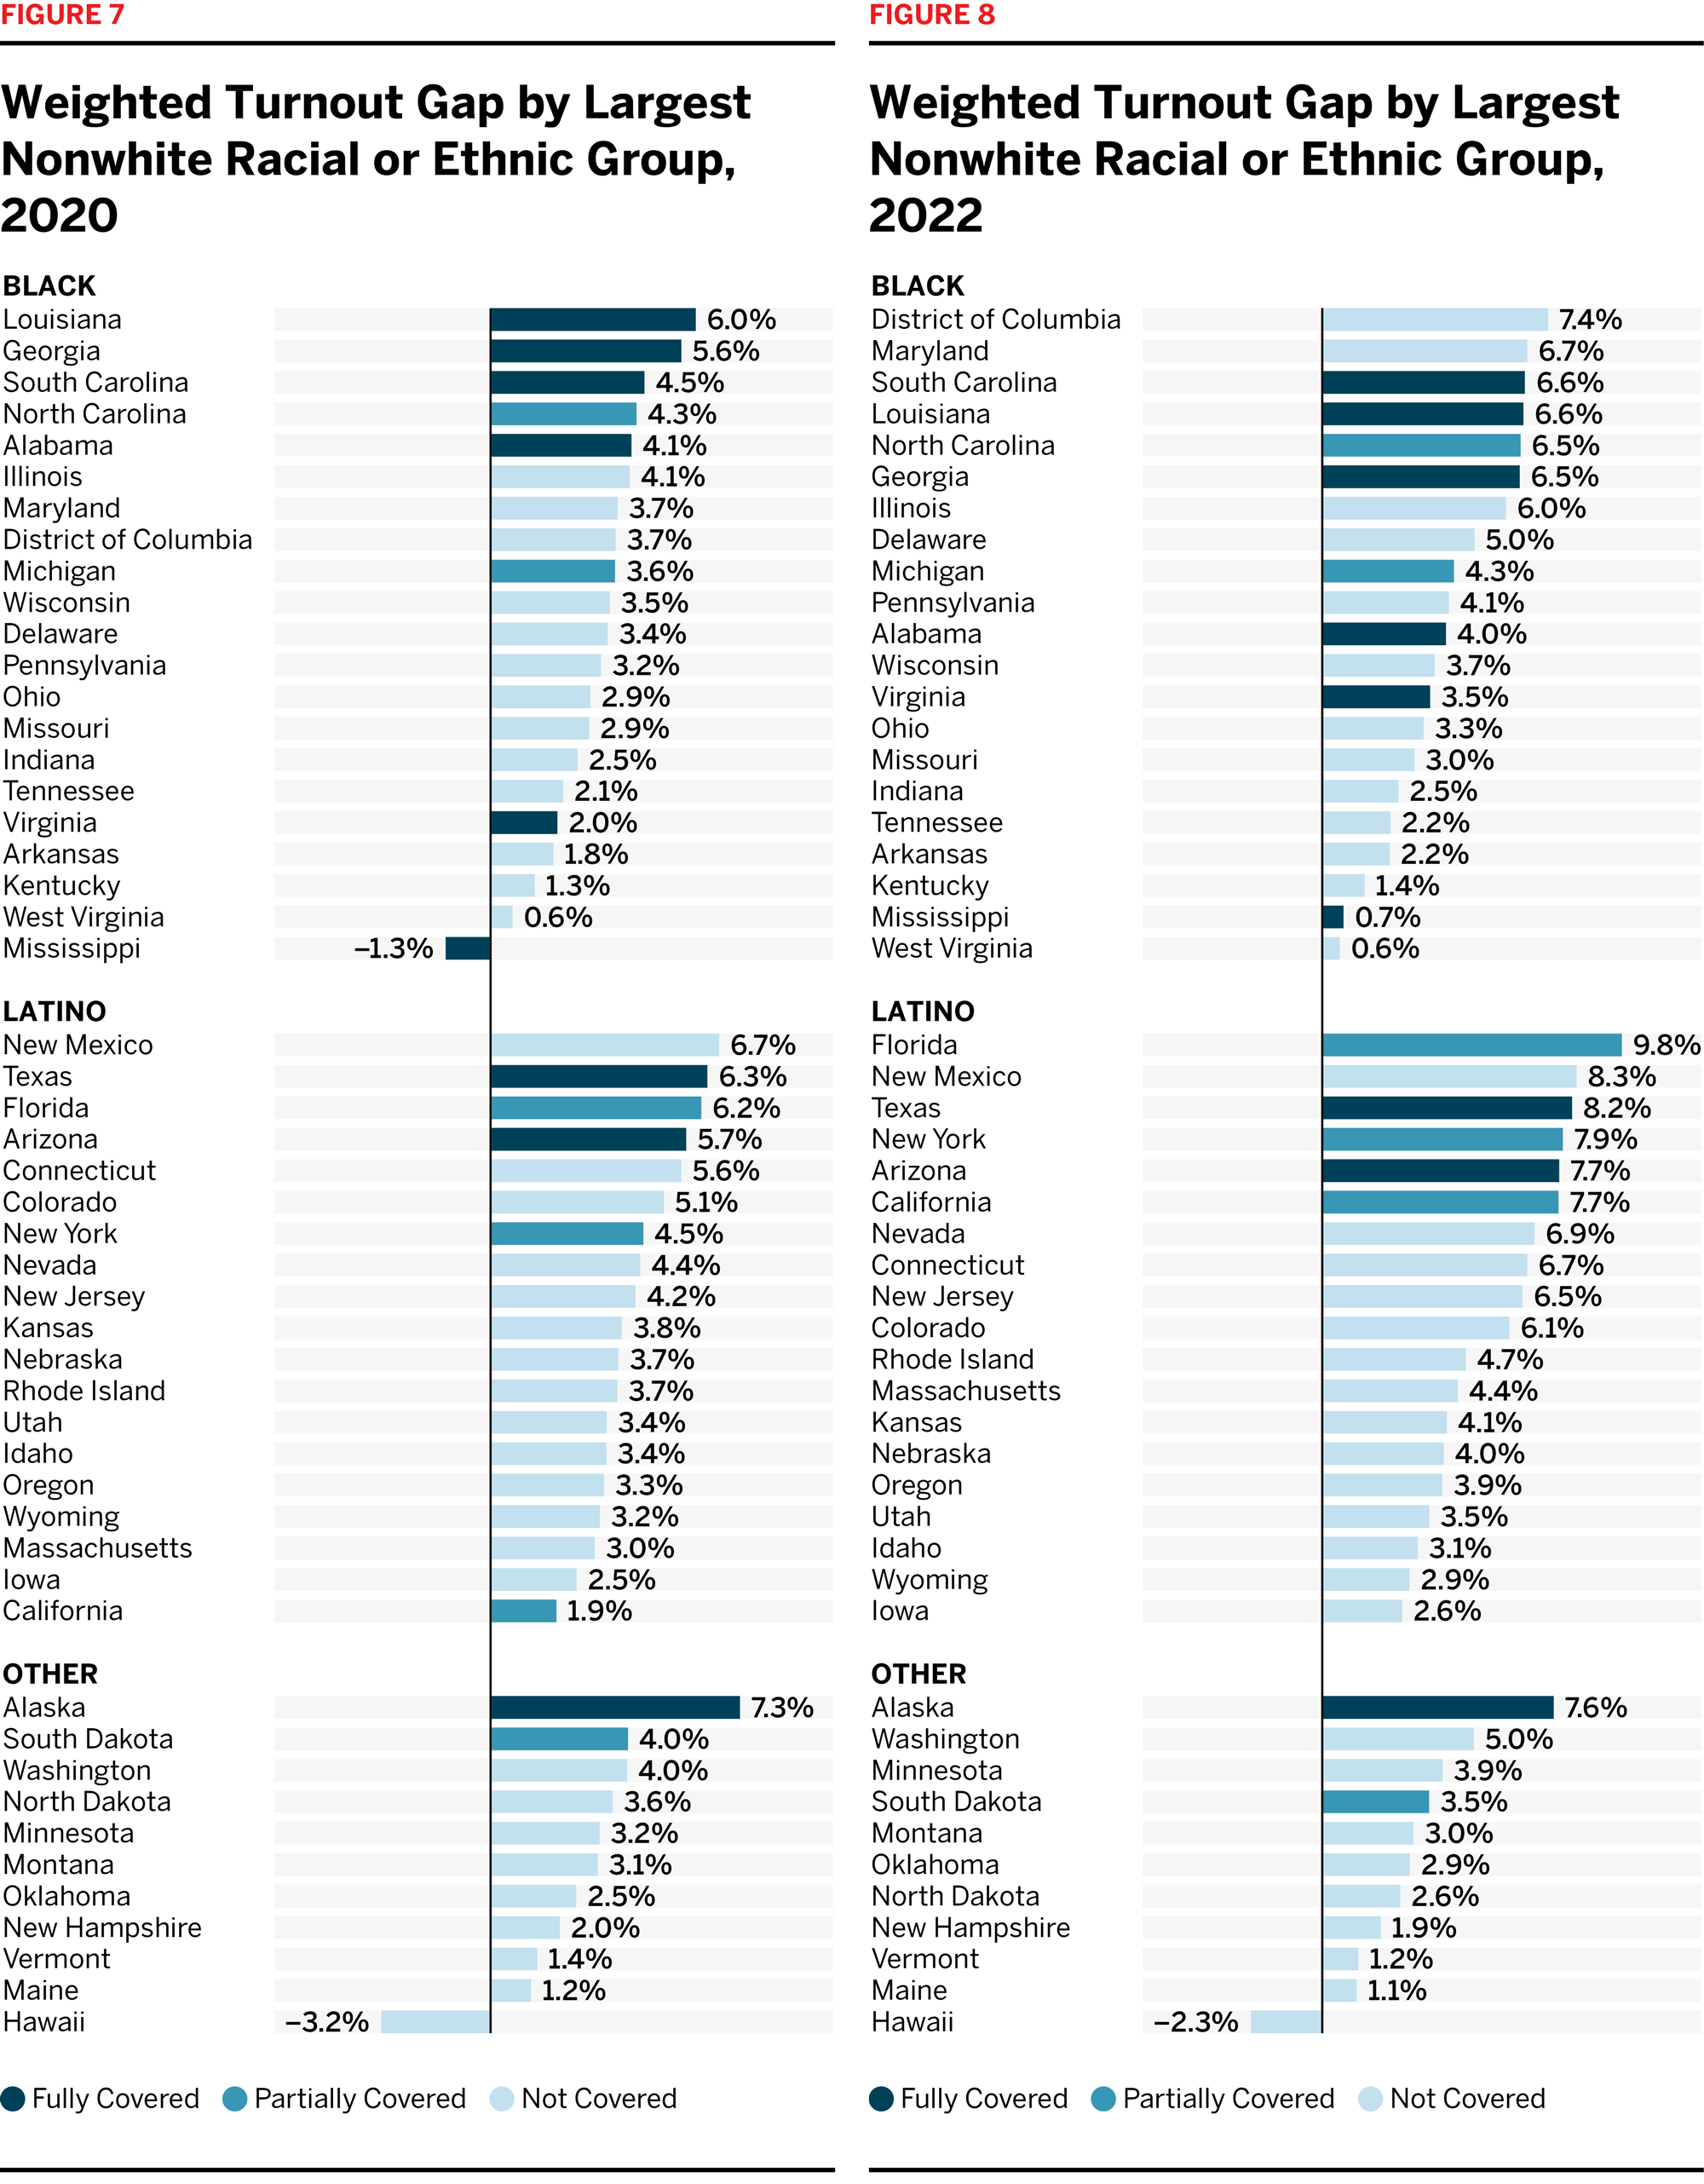

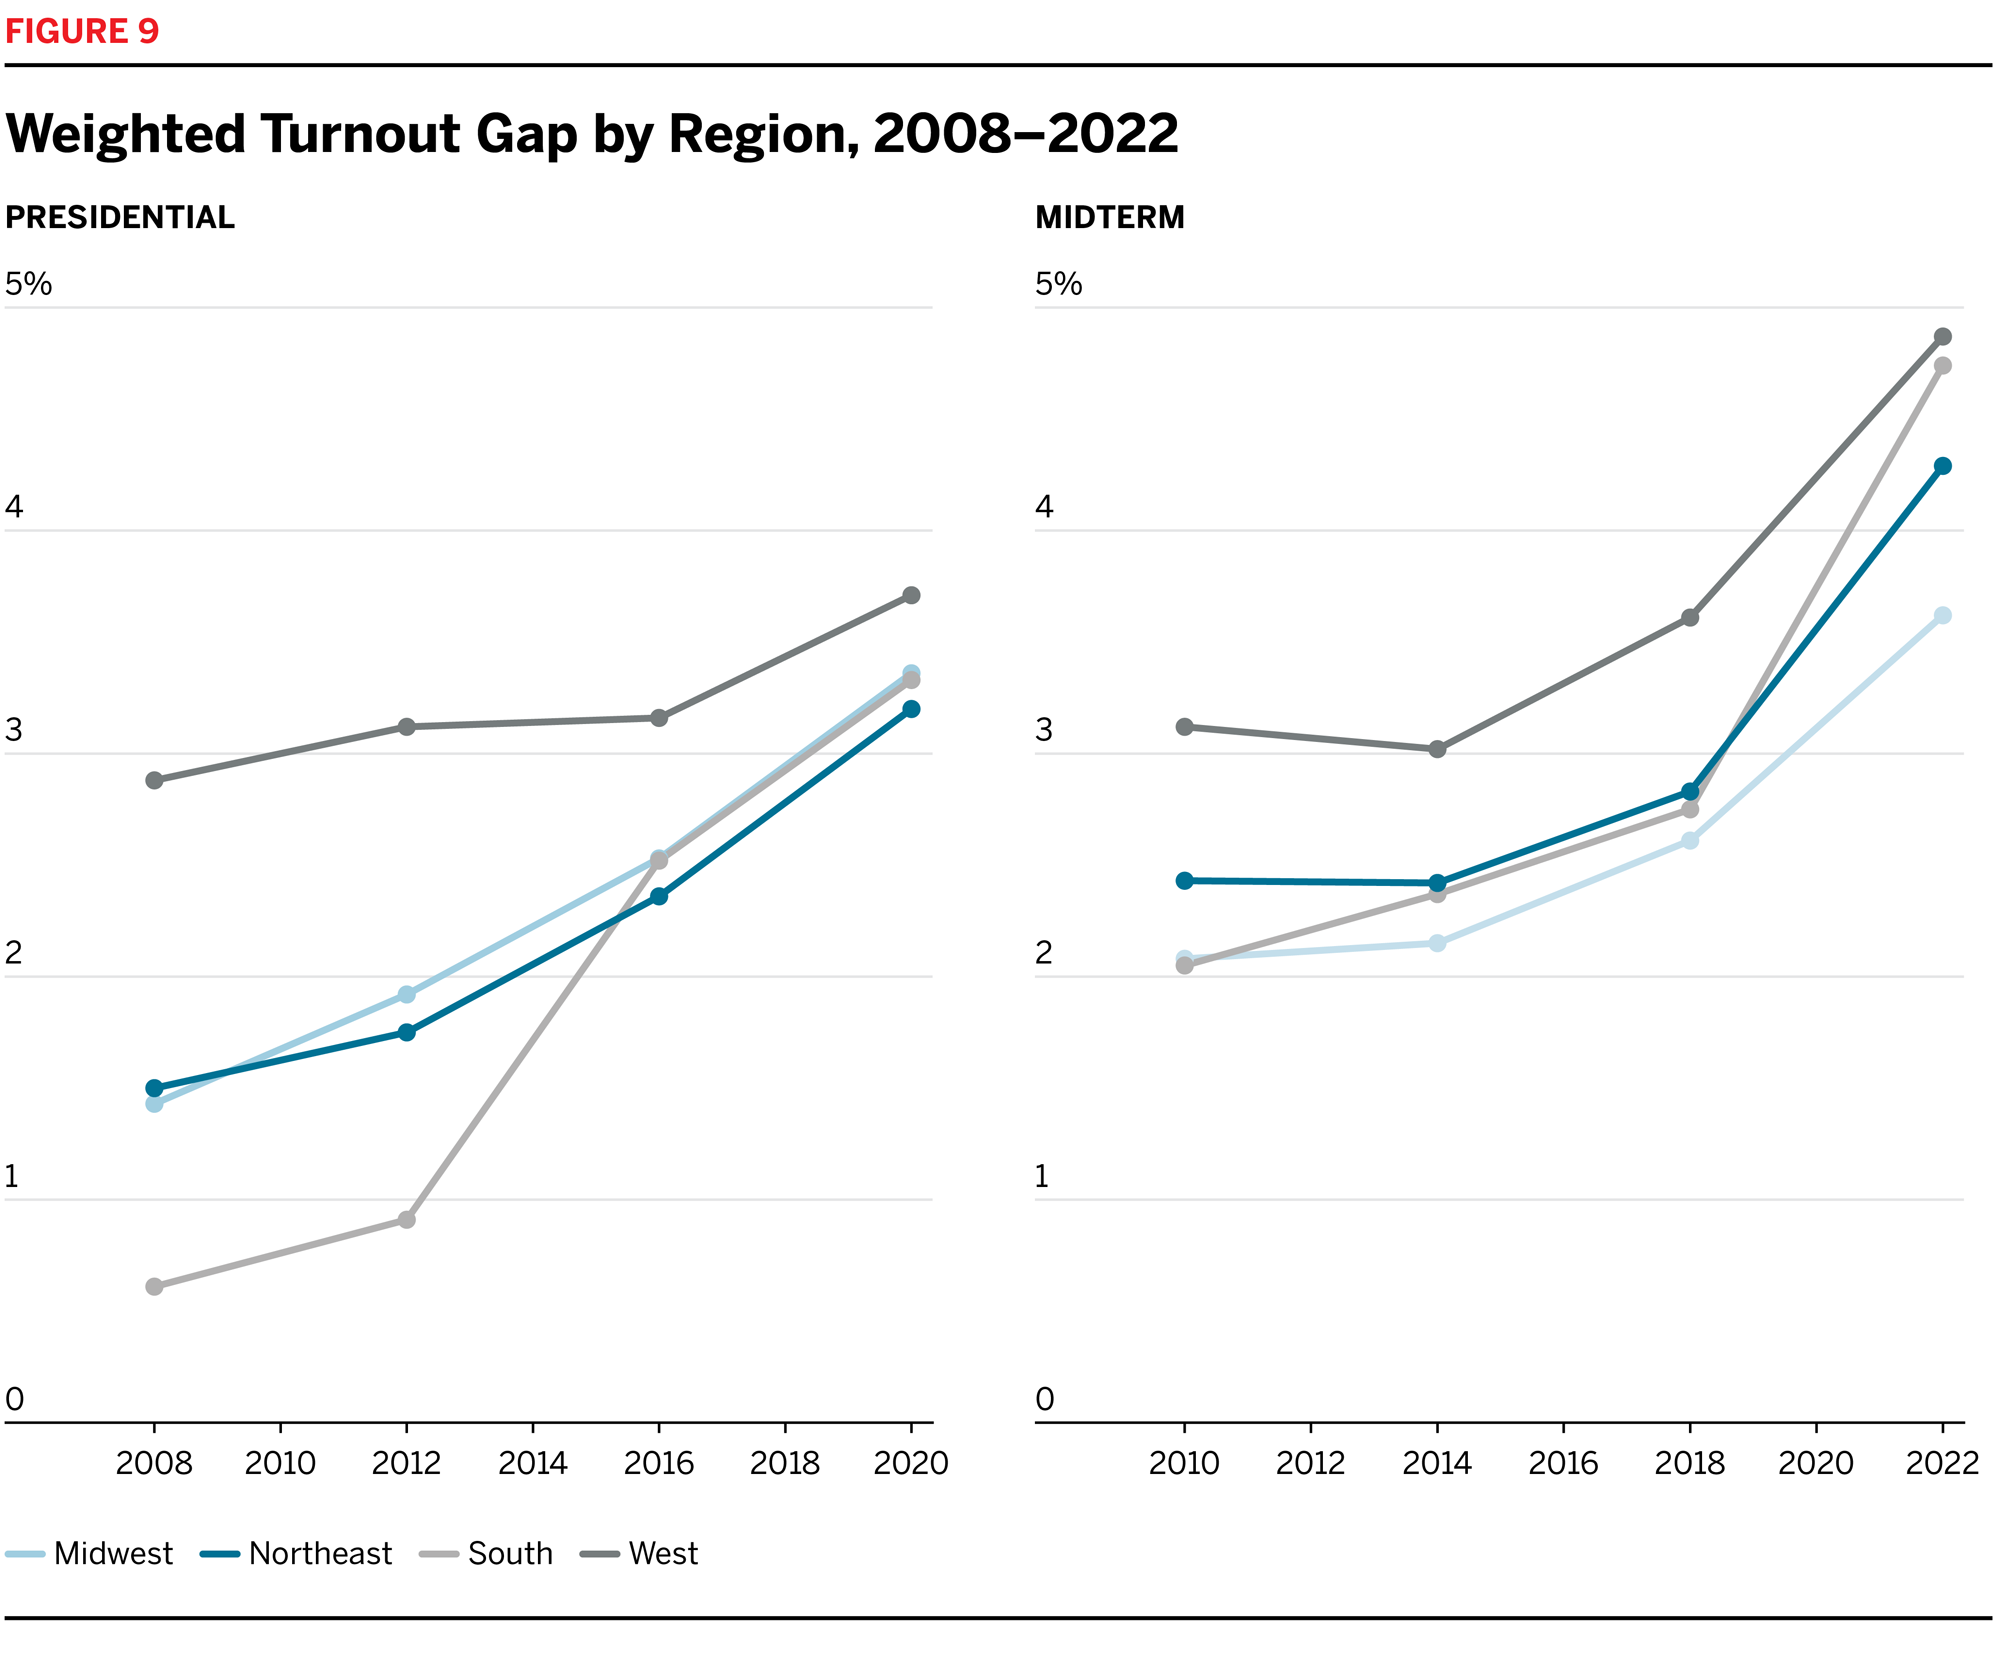
Figure 9 shows how the weighted gap has evolved over the past 15 years. We break the trends out into four major regions. The figure indicates that the weighted gap has grown nearly everywhere, just as the raw racial turnout gap has. By way of reminder, the growth in the weighted gap is driven both by changes in the turnout gap and by changes in the nonwhite share of the population; if the turnout rate is constant but the nonwhite share of the population grows, the effect of the turnout gap on statewide turnout increases.