Appendix 1: Felony Disenfranchisement Methodology
Our estimates rely on a number of assumptions and methodologies due to complexities and ambiguities in the laws governing voting rights and the limitations of the available data on the relevant justice-impacted populations. Here we detail our team’s research approach and the methodological choices we made in addressing these limitations and complexities. With each iteration of our report, we attempt to update and improve our estimates and the methodology that underlies them. Although we recognize that some degree of error likely remains, we have done our best to avoid systematic errors and biases in compiling these figures.
Populations in the Criminal Legal System
Prison, probation, and parole populations were obtained from the National Prisoner Survey, BJS Data Tools, and supplemented with data from the BJS Prisoner and Probation and Parole reports, which contain the most recent observed correctional populations (2022). The data reported are thus based on estimates of the most recently available data, though we caution that such counts have fluctuated greatly since the Covid-19 pandemic. Probation populations were adjusted by the percentage felony probation among all probationers in 2018 (most recent observed data point available from the Annual Probation Survey), assuming that the percentage of people with felony convictions is uniform across race, ethnicity, and sex (a required assumption without cross-tabulated race and charge counts). This methodology is commensurate with previous Locked Out estimates. For states with missing data on current felony probation and parole subpopulations in a given state and year, the race and sex estimates are based on the share of the known prison population in each race or sex group.
Jail counts were sourced from the BJS’ Annual Survey of Jails (ASJ). The ASJ is a probability sample of jails within U.S. jurisdictions conducted annually. We calculate the jail populations at mid-year 2022 (most recent data in the series available) by aggregating overall, race-specific, and sex-specific design/nonresponse weighted sums within each U.S. State. We calculate each state’s percentage felony in jail by aggregating the weighted felony counts and weighted total counts and calculating the weighted proportion of percentage felony (felony weighted/total weighted). We then compile a similar aggregation to obtain the proportion convicted for each state. These two proportions are then multiplied to obtain an adjustment factor indicative of convicted felony status. This adjustment factor is then applied to the overall mid-year jail population in 2022 for each state to estimate the number of people incarcerated in jail convicted for a felony offense. The ASJ does not include a cross-tabulation of felony status and conviction status, nor does the survey have felony and convicted counts by race and gender subgroups. Previous Locked Out reports assumed a uniform 10% felony adjustment to all jail numbers, and this improved method allows each state to have its unique percentage felony and conviction percentage to adjust the jail count for each population (the 10% figure applied in previous reports represents an underestimate for most states and years, therefore we have somewhat higher jail estimates in the 2024 report than in previous years). Because race-, ethnicity-, and sex-specific felony-convicted jail counts are not available, we assume stability in the adjustment factor across demographic categories and apply this adjustment to the overall and subpopulation overall counts to estimate the jail population convicted of felonies.
For disenfranchising states with an integrated jail/prison system (Alaska, Connecticut, Delaware, Hawaii, and Rhode Island), current correctional populations are reported to the Bureau of Justice Statistics as one number and therefore not disaggregated by jail and prison populations. We adjusted the total reported prison populations in Alaska, Connecticut, Delaware, Hawaii, and Rhode Island downward by deducting the estimated percentage of people who are serving non-felony sentences or awaiting trial. To do so, we consulted annual reports from state-specific sources (e.g., Alaska Criminal Justice Commission, the Connecticut Office of Legislative Research, the Delaware Department of Correction, the Hawaii Prison Profile Dashboard, the Rhode Island Department of Corrections) and the Bureau of Justice Statistics Data Tool (“Maximum Sentence Length for Inmates” in 2021, the most recent year available). This information allows us to effectively remove the estimated number who are incarcerated but not legally disenfranchised from the total integrated system number reported to the Bureau of Justice Statistics.
Data on race and ethnicity have not been consistently collected or reported in the data sources used to compile our estimates, so our ability to construct these estimates is limited. This is especially the case for Latino populations, who now constitute a significant portion of criminal justice populations. Race data on criminal justice populations is more complete, at least for African American populations, and we used the most recent data available from the Bureau of Justice Statistics to develop the state-specific disenfranchisement estimates for the African American voting eligible population (shown in Figures 6 and 7 and Table 3). For the 2024 estimates, we used the U.S. Census Bureau’s American Community Survey data to obtain denominators for both the overall and population-specific voting eligible populations. As noted below, our estimates are based on race-specific recidivism rates (resulting in a higher rate for African Americans) that reflect current scholarship on punishment and recidivism. This results in a higher rate of attrition in our life tables, but produces a more conservative and, we believe, more accurate portrait of the number of disenfranchised African Americans.
Life Tables
We construct 100 life tables, covering 10 post-sentence disenfranchising states, 5 correction population groups, and for both post-sentence prison releases and felony probation entries (10 post-sentence states * 5 populations of interest * 2 correction populations = 100 life tables). Each life table takes historical correctional cohorts each year from 1948-2024 (assuming stability in correctional inputs from 2022 for years 2023-2024), and adjusts each cohort iteratively each year until 2024 with the following formula:
Ritcg— Citcg — Ditcg = Gitcg
where Ritcg is the number of individuals in a correctional cohort (prison releases or probation entries, described below) released or remaining from the previous year in each state (i) and year (t) from a particular correctional population (c) and subgroup (g) (overall, African American, Latino, male, female), Citcg is the number of individuals in a particular cohort estimated to have been reconvicted (and therefore appears in current population counts or enters life tables in a subsequent cohort), Ditcg is the number of individuals in the particular cohort estimated to have died, and Gitcg representing the number of individuals remaining as of 2024 in a particular post-sentence cohort. We then sum the estimated remaining as post-sentence individuals in 2024 across each release/entry cohort (t) within each particular correctional population (c), subgroup (g), and state (i) to obtain an estimate of the number of post-sentenced individuals barred from voting. We then apply to these estimations various adjustment factors as described below. More details on our life table approach are available in Shannon et al. (2017) and Uggen and Manza (2002).
Prison, Parole, Probation, and Jail Population Inputs
The correctional inputs for the overall prison life tables consist of conditional and unconditional releases from state prisons. For early years, our data sources are primarily United States Department of Justice (USDOJ) publications, including annual series such as Probation and Parole in the United States, as well as Prisoners and Jail Inmates at Midyear. We also referenced National Prisoner Statistics, and Race of Prisoners Admitted to State and Federal Institutions, 1926-1986. Contemporary conditional and unconditional prison releases were obtained from the BJS Prisoners reports. Specifically, for 2022 the numbers are located in Table 9, which details the 2021 and 2022 conditional and unconditional releases for each state. Because 2023 and 2024 data are not yet available, stability is assumed from 2022 for all life table correctional inputs.
Our life tables use probation entries instead of exits so that we can best account for recidivism and death processes in our calculations (we adjust for double counting of current populations by subtracting our current felony probationers as described below). The correctional inputs for the felony probation life tables consist of probation entries for each state (adjusted for 2018 percent felony commensurate with the current probation populations – again, the most recent available) and felony jail counts in each year obtained via Vera’s Incarceration Trends Dataset (2007-2018) and the BJS’ Annual Survey of Jails (2020-2022). 2019 is interpolated as no ASJ was fielded by the BJS in that year. All correction population inputs assume stability from 2022 to estimate 2024 correctional populations to avoid “carrying forward” any post-covid changes in punishment patterns into the future.
Jail numbers were calculated commensurate with the approach described above for the current populations (we also adjust for double counting here by subtracting out current jail populations) both for the overall estimates and each subpopulation. Previous Locked Out reports (2020; 2022) used the Vera Incarceration Trends data, which include the ASJ as its primary data source. Vera’s data only goes to 2018 (as of 6/21/2024). Therefore, we back-fill our life tables with observed data from 2020-2022 from the ASJ. The BJS did not release an ASJ in 2019, so the values for 2019 are interpolated as the midpoint between 2018 and 2020.
Conditional and unconditional releases for the African American (AA) life tables are estimated by adjusting the overall conditional and unconditional releases for each post-sentence state by the percent AA prison in each respective year for the unconditional releases and the percent AA parole (2018 – the most recent year from BJS’ Annual Parole Survey) for the conditional releases in each year. African American felony probation estimates for life table entry were obtained by adjusting the yearly overall probation entries by both the 2018 percent felony adjustment factor (the most recent year available from BJS’ Annual Probation Survey) and the percent AA probation in each respective year. For 2007-2022, the jail inputs reflect felony adjusted African American jail midyear populations as reported by the Vera Incarceration Trends Dataset (2007-2018) and BJS’ Annual Survey of Jails (2020-2022) (2019 is interpolated commensurate with above).
Correctional ethnicity data is historically sparse. Therefore, we utilize a data augmented extrapolation technique to estimate the proportion of prisoners and felony probationers that are of Hispanic ethnicity. Specifically, we use observed percent Hispanic from the BJS’ National Prisoner Statistics (1978-2022) and Annual Probation Surveys (1994-2018). For recent years not yet observed in each series (e.g., after 2022 for prison), we use a linear extrapolation of the percent Hispanic from the most recent two observed data points for each series. For the historical missing proportions outside of the observation windows of each respective data source, we augment Current Population Survey (CPS) data and estimate state-specific percentage Hispanic for both prison and probation populations by applying the state-specific percentage change in the overall state Hispanic population to each successive year historically to 1948. This assumes, historically, that the prison and probation populations evolved in concert with the overall Hispanic population in each state.
Sex-specific release data from prison, both conditional and unconditional, were obtained from the National Prisoner Statistics Dataset (1978-2022). Stability in the sex-specific releases was assumed from 2022 onwards and for years prior to 1978, when more complete annual data became available. We adjust the overall conditional and unconditional releases by the percentage male and female. Sex-specific probation entry data does not currently exist from the BJS, therefore we obtained the overall number of probation entries (as discussed above) and adjusted it using the year- and state-specific percentage male and percentage female of the probation population reported in the National Probation Survey. The percentage male and percentage female probation population proportions have varying data reporting across states and therefore several assumptions were made regarding interpolations and/or stability. Each cohort’s overall probation entries are adjusted by these sex-specific proportions. The existing overall entries were already adjusted for percentage felony, and the recent entries are adjusted by the 2018 percent felony (most recently observed). Jail entry data for the sex-specific life tables were estimated commensurate with the methodology described above using the ASJ for the years 2020-2022. For 2007-2022, the jail inputs reflect felony adjusted sex-specific jail midyear populations as reported by the Vera Incarceration Trends Dataset (2007-2018) and BJS’ Annual Survey of Jails (2020-2022) (2019 is interpolated commensurate with above). Historical jail estimates start with the legacy jail overall data series and multiply by percent male and female jail from 2007 backwards.
Recidivism
For recidivism estimates from 1984-2007, we used the Bureau of Justice Statistics’ “Recidivism of Prisoners Released in 1983” figures for the first three years (used re-incarceration figures). The BJS data indicated a recidivism rate of 18.6% by year 1, 32.8% by 2nd year and 41.4% by the 3rd. To extend the analysis to additional years, we used the ratio of increases provided by Hoffman and Stone-Meierhoefer (1980) for federal prisons to estimate 6 years of data. From these data, we obtained estimates of the percent recidivating of those remaining from the previous year. We further extended the recidivism estimates by using Broadhurst and Mailer (1990) to extend the estimates to the 10th year after release. We also inserted a specific recidivism rate for the 50th year: 65%. These data were then used to estimate a logarithmic trend line for the survival rate. The equation for the line between our 10-year data point and the 50-year point is: y=-0.0304*(Ln (x)) + 0.4636. We only used the 6th through 10th year of data for this trend line estimation since this helped to slow down the survival rate’s rapid decrease. This equation enabled us to gain estimated percent recidivating each year, through 50 years. By the 10th year approximately 59.4% of the original cohort of released individuals had recidivated (or about 3.33% of those remaining after the 9th year). By 20th year: 62.7%, 30th year: 64.0%; 40th year: 64.9%; and by year 50: 65.5% of the original cohort of released individuals had recidivated (or about .178% of those remaining from the 49th year). Our Locked Out reports for 2016, 2020, and 2022 use these recidivism estimates.
For Locked Out 2024, we improved upon our legacy recidivism methodology by (a) using a newer BJS recidivism study upon which to base our estimates for the overall life tables 2008 and onwards (Antenangeli and Durose 2021) and (b) making our recidivism estimates population dependent by allowing each recidivism curve to vary by each respective population under estimation (Overall, African American, Latino, Male, Female). Legacy recidivism curves are used for years 1948-2008 in the overall life tables. The new recidivism curves are used in the cohorts from years 2008-2024 in the overall tables.
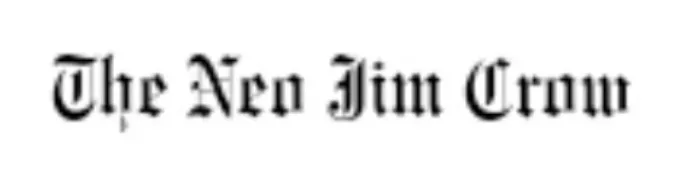
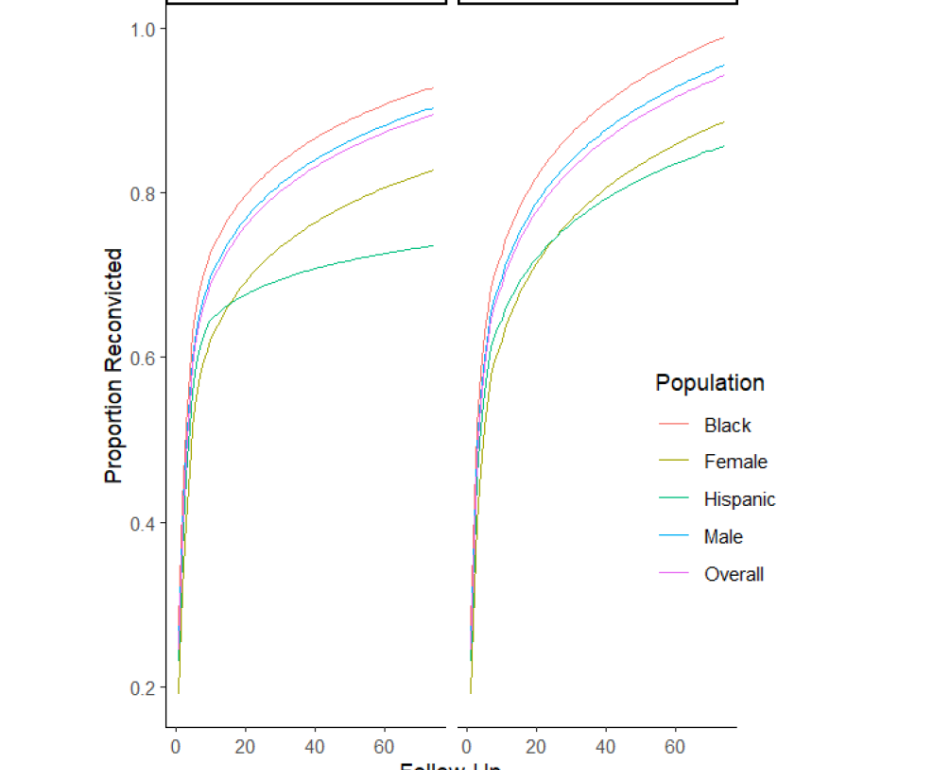
For population-specific recidivism estimates, we used the Bureau of Justice Statistics’ Recidivism of Prisoners Released in 24 States in 2008 (Antenangeli and Durose 2021) which contains a 10-year reconviction follow up for each population. We then model the cumulative failure from years 11-74, using both Uggen’s method (Uggen and Manza 2002) (the model used to create the recidivism curves in previous Locked Out iterations) and a generalized additive model (GAM) using a population-specific cubic spline. For Locked Out 2024, we use the GAM method, and predict cumulative failure for years 11-74. We choose the GAM method, as it is more sensitive to the “tapering-off” of recidivism failure in the later observed years. From these predictions, we obtained estimates of the percent recidivating of those remaining from the previous year by dividing each year’s predicted failure rate by the lagged cumulative survival, obtaining a recidivism hazard for each year (years 1-10 use the observed data points). Cumulative failure of recidivism amongst those released from prison by year 74 follow-up is estimated to be 89.5% overall, 82.8% for females, 90.4% for males, 73.6% for Latino releasees, and 92.9% for Black releasees. These population-specific recidivism hazards are used for all cohorts from 1948-2024 in the population-specific life tables.
Recidivism Cumulative Failure by Population
BJS 2008 Special Report
For probation recidivism in our updated methodology, population-specific recidivism estimates are not published by the BJS. Therefore, we used the BJS’ 2016 probation recidivism study (Markman et al. 2016) and used the state-level cumulative failures for follow ups from 1-5 years (from Figure 4 in Markman et al. 2016). These were used to create yearly recidivism hazards commensurate with the method for prison described above. These estimates were then used to create an overall ratio between the prison recidivism and observed probation recidivism (years 1-5). The year 5 ratio was assumed stable moving forward (6-74) to estimate both overall population-specific probation recidivism to follow-up year 74.
Mobility
Our estimates do not include adjustments for interstate mobility. This is unlikely to have a large effect on current populations, but could influence the post-sentence population. There are two key issues in this regard: (1) interstate migration; and (2) whether people are disenfranchised in their current state if convicted elsewhere. In previous work modeling interstate mobility (Shannon et al. 2017), we found that adjustments for interstate movement play a relatively small role in estimating state post-sentence populations. This model applied mobility data from the general population to the formerly-convicted population, but little is known about how mobility patterns of this population might differ from the population as a whole. Several Urban Institute reentry studies suggest that at least 95% of the former prison population remains in the same state postrelease (LaVigne and Kachnowski 2003; LaVigne and Mamalian 2003; LaVigne and Thomson 2003; Watson et al. 2004). Overall, more people are moving to growing Southern states with stricter post-sentence disenfranchisement regimes than are leaving such states.
Mortality
For the death rate in the early life table years we also used BJS’s Recidivism of Prisoners Released in 1983 (Beck and Shipley 1989) and noted a rate of death of .0086535 by the third year after release (159 out of 18,374). To compare, we used National Corrections Reporting Program (NCRP) data for state-specific age at release. Using the NCRP median age for each state (when available — when unavailable used national median age) in each year, we used the Statistical Abstract of the United States to find the expected number of deaths for black males of the appropriate age (the highest death rate available among all reported groups). We find a slight difference between these two rates (with the released prisoner death rate highest), so in order to adjust our rates, we continue to use NCRP data for median age at release, and the Statistical Abstract’s expected rate of death, but we multiply these values by a constant (approximately 1.46 — multiplying the Statistical Abstract numbers from 1983 by 1.46 increases our death rate to that reported by the BJS). NCRP data are not available prior to 1983, so death rate for previous years was similarly obtained from the Abstract, but we used the average median age at release in the last three years we had data (1983-1985).
The all-cause population death rates for AA males (applied to all populations except for the sex-specific sub populations) were obtained from the CDC Wonder data tool for years 2018 onwards. Specifically, our estimates use the Underlying Cause of Death, 1990-2022 data series (for each respective year) using single-year ages for the Black or African American males for ages 25+. The crude death proportion for each age is calculated simply as death divided by population, which results in the proportion of AA males in a given year and age group to have succumbed to mortality. We carry forward the inmate adjustment as described above. We assume stability in death rates from 2022, to avoid “carrying forward” any post-covid mortality improvements from 2021-2022 into years where we expect the mortality improvements to have tapered off. NCRP data is used to key each death rate to the median age of release. Because publicly available NCRP data only includes a categorical age variable, a sampling technique is used to (a) stratify the data by release year, state, age of release, (b) sample for each case an age within the range of ages captured by the category of the case, (c) assign that case the sampled continuous age, and (d) calculate the median age of release on the sampled variable. This process assumes that the ages within each age bucket follow a uniform probability distribution within each response category.
Both the overall estimates and the African American and the Latino estimates use the death rate for AA males, adjusted for inmate mortality, as described above for the reasons of (a) parsimony with previous estimates, and (b) to make a conservative assumption of estimated mortality for the overall and Latino tables. However, due to the large extant sex-gaps in mortality, we use sex-specific mortality rates in the sex-specific estimates. We used CDC’s Wonder database for African American Male and Female death rates from 1999-2022. We supplemented historical sex-specific death rates from the Statistical Abstract of the United States. Death rates are entered into the sex-specific life tables keyed to the median age of release as estimated from the National Corrections Reporting Program (NCRP) data from 2017-2020, and stability is assumed from 2020 for the years 2021-2022. Death rates for both males and females are keyed to the NCRP median age of release as used historically in the overall life tables from 1948-2024. Each death rate was adjusted by the “prison” correction from the overall life tables (1.46).
Adjustment Factors
Double-Counting
Our focal input data to our post-sentence life tables are released from prison (both conditional and unconditional) and entries to felony probation. Therefore, there is a possibility that individuals released from prison are double-counted in parole populations and that our “post-sentence” felony probationers may be double-counted in current felony probation and jail counts. Therefore, we subtract the current parole, felony probation, and jail counts from our post-sentence estimate to avoid potential double counting. We subtract commensurate with each state’s disenfranchisement law (e.g., Delaware only has parolees subtracted due to its restriction of post-sentence disenfranchisement to a restrictive list of severe offenses such as homicide).
Clemency and Restoration of Civil Rights
For each of our post-sentence states, we subtract out the known clemencies and pardons reported to us by the appropriate state agencies. In our 2024 report, Alabama reported completing 8,296 investigations for voting rights and pardons in 2022 and 2023; the Arizona Board of Executive Clemency reported 2 pardons granted for 2022-2024, but this number does not include any rights restoration in county courts; the Delaware Board of Pardons reported granting 952 pardons and commutations for 2022-2024; Florida did not respond to our 2024 requests but in fiscal years 2021-2023 the Florida Commission on Offender Review reported 15,116 clemency cases completed. Iowa has automatically restored voting rights post-sentence for non-homicide convictions since Executive Order 7 was signed in 2020, but reported 6 pardons in 2022-2023; Kentucky reported 189,612 were awarded their voting rights, either through pardon or other restoration means from 2020-2024; Mississippi reported 79 restorations from 2022-2024; Virginia reported 6,540 restorations from 2022-2024; Wyoming reported 8 pardons and 3 restorations from 2022-2024. To estimate the number of subpopulation specific clemencies (e.g., number of female restorations), we adjust the overall number of clemencies by the ratio of pre-clemency subpopulation post-sentence population to the pre-clemency number of overall post-sentence population. In Alabama and Mississippi, we only deduct the proportion of total clemencies applicable to disenfranchising offenses, commensurate with the state-specific adjustments described below.
State-Specific Assumptions
Alabama
Alabama has a defined list of felony-level offenses that are disenfranchising, which they characterize as “crimes of moral turpitude” (identified here). We were not able to obtain complete historical conviction data for Alabama to precisely estimate the proportion of those with felony convictions who are disenfranchised. We did, however, obtain data on those currently in custody of the Alabama Department of Corrections (ADOC; as of August 23, 2024), including their current offenses and offenses for which they were previously incarcerated. We estimated the proportion of those who were disenfranchised in ADOC custody by identifying each person within the dataset who had at least one disenfranchising offense (0.75), and then applied that proportion to our counts. This approach assumes that convictions for crimes of moral turpitude (e.g., Burglary I and Burglary II but not Burglary III) would be sentenced to prison. To calculate the adjustment factor, we estimated the proportion of current ADOC population in custody who had been convicted of a disenfranchising offense (.75) and the proportion of Black people in ADOC custody convicted of a disenfranchising offense (.82). Note that Alabama estimates in Tables 2-6 do not represent those who are disenfranchised because of their present correctional status; rather, these estimates represent the present correctional status of those who are disenfranchised due to a conviction for a disqualifying offense in Alabama.
Arizona
Arizona’s post-sentence disenfranchisement only applies to those who are convicted of a second felony. We were not able to obtain robust current historical criminal conviction history data from Arizona to estimate adjustment factors for the post-sentence population. We adjust our post-sentence populations in the life tables and assume that 50% of prison releases and 26% of probation entries meet this criterion, as BJS documentation suggests 26% of total probation and jail inmates and 50% of prison and parole releases had a prior felony conviction (Langan and Cunniff 1992). This is commensurate with previous Locked Out reports.
Delaware
Delaware has an ineligibility list regarding certain felonies (murder, manslaughter, bribery/public corruption/sex offenses) which we estimate represents .094 of post-sentence individuals eligible for this list, based on the estimated national proportion of these offenses among people released from prison. As mentioned above, we only subtract current parole populations as the individuals eligible for this list will only be potentially double counted in the parole (rather than probation) population.
Florida
Our estimates for Florida assume that 67% of the total Florida post-sentence population has outstanding legal financial obligations or other restrictions that would disqualify them from restoration of civil rights under current Florida law and administrative practices (see Florida Commission on Offender Review, Rules of Executive Clemency 2022). This is the figure we had calculated for our 2022 report and it matches information received from the Florida Rights Restoration Coalition felony conviction database (personal communication with Al Barrentine, FRRC Director of Technology and Data Science, July 26, 2024). We apply this adjustment to both the post-sentence life table output and the double counting chunks subtracted. In Florida, some can avoid a formal felony conviction by successfully completing a period of probation. According to the Florida Department of Law Enforcement, as much as 40% of the total probation population holds this “adjudication withheld” status. According to reports by the Bureau of Justice Statistics, only about 50% of Florida probationers successfully complete probation. In light of this, we reduce the annual current disenfranchised felony probation numbers by 40% and individuals disenfranchised post-sentence by 20% (.4*.5=.20).
Iowa
Iowa has automatically restored voting rights post-sentence for non-homicide convictions since Executive Order 7 was signed in 2020. Post-sentence disenfranchisement had been reinstated in 2011 and therefore our life table counts only cohorts from 2011 prison releases and probation entries onwards. Today, Iowa restricts the right to vote only to those qualifying under statute 7.07 (felony murder) and therefore we adjust prison and felony probation life table output by .013 and subtract parole to avoid double counting. We estimate the proportion of people post-sentence that are chapter 707 cases (and thus disenfranchised) based on prison release patterns from 07/01/2014-08/08/24 (see, e.g., https://data.iowa.gov/Correctional-System/Offenders-Released-from-Iowa-Prisons/runv-jsix/about_data).

Kentucky
Kentucky disenfranchises post-sentence individuals only if they match an eligibility list (treason, bribery in an election, criminal or fetal homicide, second-degree assault or assault under extreme emotional disturbance, first-degree strangulation, human trafficking, or violence). We assume 55% of prison releases and 20% of felony probation entries for cohorts since 2020 match the above list, after a 2019 executive order reenfranchised all those not eligible for the list via clemency. Therefore, we only subtract a portion of each current population (.39 for parole, .2 for felony probation and jail) to avoid double counting.
Louisiana
In Louisiana, people currently serving probation sentences and parole sentences who have not been incarcerated in prison during the previous 5 years are eligible to vote. We lack detailed data on the number of people within the 5-year window, but it includes the clear majority of people on parole in Louisiana and relatively few people on probation. Our estimates assume that 90% of people currently on parole and 10% of people currently serving felony-level probation sentences have been incarcerated in prison within the previous five years or convicted of a disqualifying offense, and are therefore disenfranchised.
Mississippi
Mississippi disenfranchises people convicted of 22 general crimes for life unless they are restored through an act of the state legislature. Although many of these general crimes do not directly map on to existing statutes, the Mississippi Administrative Office of Courts (AOC) maintains a list of disenfranchising offenses that fit within the scope of the 22 general crimes based on the interpretations of the Mississippi Constitution by the Mississippi Attorney General’s Office or the courts (found here). We obtained criminal court conviction data for cases with dispositions from 1995 through 2018 (we also obtained data for 2019 through 2023, but the MS AOC would not provide date of birth information). We used the Python package Dedupe (Gregg and Eder 2022) to create person level identifiers, and then estimated the proportion of those who had been convicted of a disenfranchising offense within the available period of the data (1994-2018) (.28). Given that this period is missing individuals who were missing from the Mississippi data in the earlier years (pre-1994) and have longer exposure times to garner a disenfranchising offense, we adjust this proportion upwards by the ratio of missing cohort counts to observed across our study period, resulting in a final overall adjustment factor of .31. The Mississippi data also display stark racial disparities in the proportion of disenfranchising offenses between Black and non-Black defendants (specifically, 1.8 times on average across the series), making a stability assumption for the adjustment factor between our overall and Black estimates untenable. To avoid undercounting the number of disenfranchised Black Mississippians, we therefore calculate a Black-specific adjustment factor that accounts for this disparity via solving the following weighted average formula: .31 (overall adjustment) = +(1.8*x*(unadjusted Black post-sentence pop/unadjusted non-Black post-sentence pop)))/2. This solves for the non-white adjustment factor, while keeping the combined overall adjustment constant and weighting each adjustment by the ratio of non-Black and Black pre-adjusted post-sentence estimates. We then obtain the Black adjustment factor by taking the non-Black adjustment factor .22, and multiplying by the observed Black to non-Black ratio 1.8 for a final Black adjustment factor of .40. We applied this proportion to our counts under the assumption that the general ratio of disenfranchising to non-disenfranchising offenses is relatively stable over time. Mississippi estimates in Tables 2-6 thus represent the present correctional status of those who are disenfranchised because of a conviction for a disqualifying Mississippi offense rather than those who are disenfranchised based on their present correctional status.
Tennessee
In Tennessee, we count all pre-1973 individuals (conditional on offense), and all individuals in years 1981 and after, as Tennessee citizens were not disenfranchised from 1973-1981 and the 1981 restrictions were not retroactively applied to release cohorts within this window. Tennessee also has an eligibility list that prevents some post-sentence individuals from applying for voting restoration, and therefore we subtract out the successful applications via our clemency numbers (pardons and reported successful applications since 2018 according to the TN Secretary of State). Although Tennessee has a number of mechanisms to restore voting rights, relatively few are successful in attaining restoration. The Tennessee Secretary of State’s office reported that only 3,350 Tennesseans regained their voting rights from 2018-2023 (McGee 2023).
Wyoming
Wyoming restores voting rights after a five-year waiting period to people who complete sentences for first-time, non-violent felony convictions. Therefore, we adjust our life tables by the following factors: prison (assuming .55 non-first-time, .50 violent); felony probation (.26 non-first-time, .2 violent).
Consistency with Past Estimates
Based on our legal review and consultation with experts in Alabama and Mississippi, we updated our 2024 methodology to include more refined estimates of the ineligible populations in these states. This means that our estimates now exclude people convicted of felonies that do not specifically appear on the state lists of disenfranchising offenses (described in the section on State-Specific Assumptions). We also adjusted our earlier published estimates for 2000, 2004, 2010, 2016, and 2022, removing those convicted of non-disenfranchising offenses in Alabama and Mississippi for these years. This resulted in a sizeable reduction in our estimates in these states, particularly in Mississippi. As shown in the table below, this also reduces our published national estimates. In 2022, for example, this reduces our published national total estimate from 4,644,708 to 4,399,983. Such estimates are also subject to error, of course, and we currently lack the data required to apply such adjustments prior to 2000. The published and adjusted estimates are equivalent for 2024.