
BlackEconomics.org®
Introduction
The purpose of this report brief explores whether and how statistics can help pay the Black American (Afrodescendant) Reparations bill should the nation ever agree to such a payment. To clarify, we support the following outcomes: Development of a comprehensive Reparations value; as the most culpable party, the US Government should pay that comprehensive value by a date certain (with flexibility to draw on all available resources); and Reparations’ comprehensive value should be extended in multiple forms.(1) We use Newton’s Second Law of Motion to build a specific case for reducing US Government expenditures for statistics, the savings from which could be used to assist in extending Reparations to Black Americans (Afrodescendants). This report brief follows directly from our April 26, 2024 analysis brief, “Can Crime Pay the Black American (Afrodescendant) Reparations Bill?”.
Newton’s Law and Saving on the Collection, Production, and Dissemination of Statistics
To venture a first rationalization for saving that might be squeezed out of funds used to collect, produce, and disseminate statistics, we employ Newton’s Second Law of Motion (NSLM; F=ma), and then account for other possible saving from the use of Big Data and artificial intelligence (AI). Stated simply, given the NSLM, the massive size of the US economy, and the fact that the featured metric for real gross domestic product (GDP) is its growth rate and not its level, there are good reasons to consider reducing expenditures to produce certain statistics that underpin GDP components.
Before considering the NSLM, we remind readers concerning a well-known colloquialism: Turning a large moving ship at sea quickly and successfully is not possible; a large and moving ship certainly cannot be turned as easily and as rapidly as a small boat. As for the NSLM, it can be dissected to show that when the same force (F) is applied to two different sized objects (masses; one large (m1) and the other small (m2)), the smaller object accelerates faster (a2 > a1). However, due to “momentum,” when the two objects experience equivalent reductions in the application of force (F), the smaller object experiences greater negative acceleration (deceleration) than the deceleration experienced by the larger object (|-Δa2| > |-Δa1|). (See Appendix I)
Applying the just given physics to economics (specifically economic growth as measured by GDP), readers are invited to imagine that: (i) The size of an economy is its mass (m); (ii) changes in economic variables and macroeconomic policies that stimulate growth (e.g., increases in the quantity and quality of employed labor, increases in the money supply and the related interest rate reductions, tax reductions, increased government spending, etc.) represent the force (F) that is applied to the mass; and (iii) growth of an economy is its acceleration (a) in an NSLM framework. Applying the result of the previous paragraph in these terms should cause one to consider that large economies require more force to generate faster growth when compared to small economies.
However, once in motion, adverse shocks that cause decelerations in growth have smaller initial effects on large economies than on small economies. A logical inference is that macroeconomic policymakers should enjoy longer response times to address negative economic shocks successfully. History tells us that shocks that cause economic slowdowns or downturns are viewed as more problematic than shocks that cause accelerated growth. Given the just-described application of the NSLM to macroeconomic analysis, policymakers may conclude that they have more time to respond to economic slowdowns or downturns than previously thought, and they may realize that they can produce equally successful results without the full complement of statistics now available to perform their work.
Is there evidence concerning the efficacy of expenditures (operational and capital) for statistics collection, production, and dissemination for effective management of macroeconomies? For decades, statisticians’ mantra has been that higher quality statistics enable improved policies and decision making. At least theoretically, high-quality macroeconomic policymaking (all else equal) should result in reduced volatility in economic performance as measured by GDP growth. We select countries’ relative standard deviations (RSD, a measure of volatility) of estimates of the rate of real GDP growth from 2000 to 2019 as the metric for measuring the efficacy of macroeconomic management (Table 1).
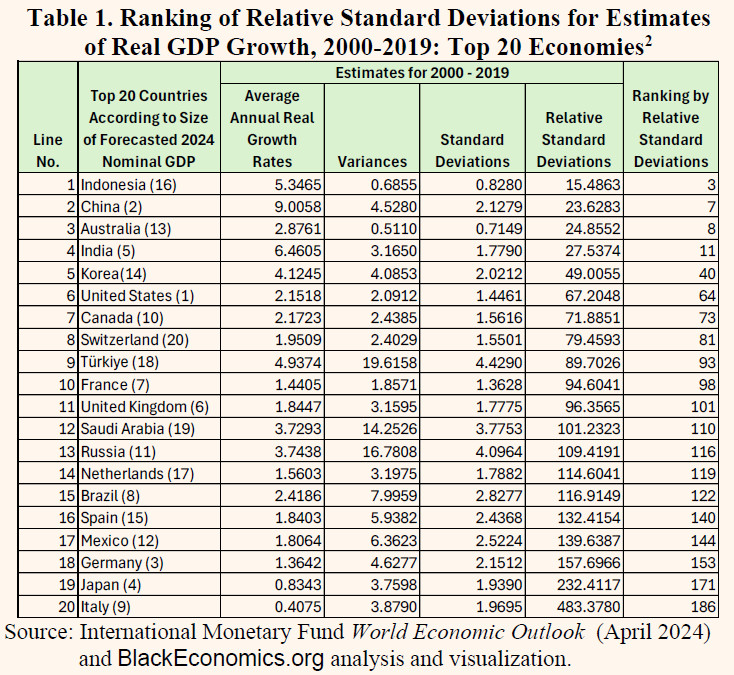
Without further analysis or interpretation of Table 1 statistics, we note that the RSD for US estimates of real GDP growth during 2000-2019 is ranked 64th out 196 countries for which the IMF provides statistics (line 6). Importantly, it is common knowledge among national accountants that, while countries seek to adhere to guidance from the international standard for preparing estimates of real GDP (the System of National Account 2008), countries’ estimates of real GDP are not perfectly comparable because there can be numerous differences in data collection procedures and coverage, statistical estimation methods and analysis, and revision policies and practices. Also, while RSD may serve as a sound statistical metric for comparing the quality of countries’ estimates of real GDP, there are nonstatistical, quality metrics (e.g., the frequency of base year updates, the version of the international economic accounting standard in use, and the relative independence of statistical agencies producing the estimates) that might be considered. Nevertheless, the US’s RSD ranking at the 64th spot, and far behind China’s (7th) and India (11th) comes as a disappointment, especially given the US Government’s massive data collection, analysis, and dissemination program.
The US’s relatively low-ranking RSD should motivate consideration of reducing expenditures for the US Government statistics enterprise engaged in collecting, producing, and disseminating statistics by 10%-to-15% percent. The magnitude of this suggested reduction is “judgmental,” but it accounts conceptually for the ease with which technology (i.e., artificial intelligence (AI), automation, and the use of Big Data produced by other sources) can, and should, enter discussions about future reductions in expenditures to produce statistics.
Cost Saving from Statistics Programs
The NSLM and Tables 1 suggest that the US may be able to reduce its expenditures for certain statistics that underpin GDP-components and still experience relatively low RSDs. This should be attempted if little-to-no loss of efficacy in macroeconomic policymaking would result from such a decision. But, as already hinted, sizeable potential future expenditure reductions can result also from the vigorous and aggressive employment of Big Data and AI in the collection, production, and dissemination of statistics. The US Department of Commerce’s Bureau of Economic Analysis (BEA) was one of, if not the, first national statistical agencies to use Big Data (scanner data) to estimate certain components of consumer spending when producing estimates of GDP.(3) Statistics Netherlands was another relatively early explorer of opportunities to expand the coverage and improve the accuracy of its estimates of GDP using Big Data while simultaneously reducing costs for the government and data providers.(4) In 2018, the International Monetary Fund began in earnest to explore leveraging Big Data to improve the quality of officials statistics.(5) Today, many countries can view Big Data and AI as likely enhancers of the quality of their statistics and as sources of potential expenditure reductions for their statistical programs.
Use of Statistical Program Cost Saving
Using the Appendix of the U.S. President’s Budget, FY 2025, expenditure values for FY 2023 were captured for important statistical programs that could be easily identified (Table 2). These programs contribute statistics that underpin US GDP estimates.
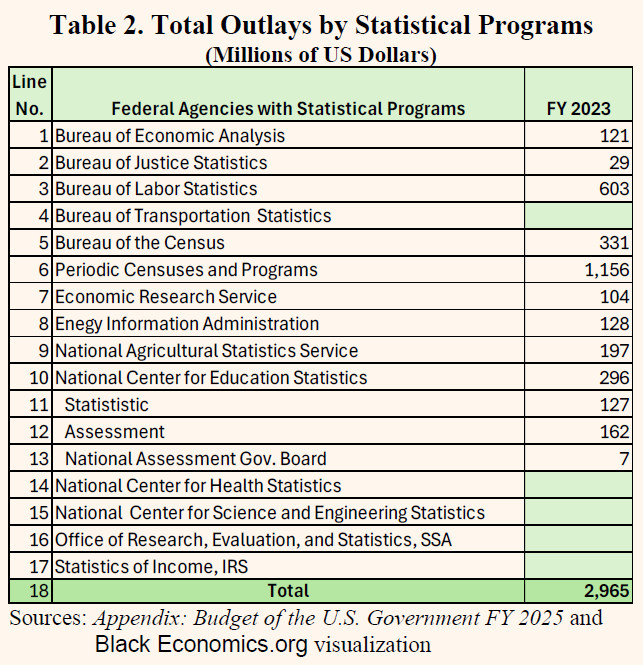
Table 2 shows that at least $2,965 million was expended by 12 of 17 easily identifiable US Government statistical programs during FY 2023. Most, if not all, these programs contributed statistics to help produce US GDP estimates. Now recall that BlackEconomics.org has suggested that the US Government extend Reparations to Black Americans (Afrodescendants) using savings generated through, inter alia, reductions in fraudulent transactions and improper payments that the US Government Accountability Office (GAO) has identified.(6) However, funds will be required to generate those saving. Hence, it seems reasonable to recommend that the US Government use savings that may result from reductions in expenditures for statistical programs shown in Table 2 ($296.5-to-$445 million; i.e., 10%-to-15%) to cover the cost of efforts to generate larger saving highlighted by the GAO.
Conclusion
This report brief presses the case that the US Government can extend Reparations to Black Americans (Afrodescendants) using funds made available by expenditure reductions that do not deteriorate materially the efficacy of one of the nation’s key statistics—GDP. (This is not to ignore that there are other likely sources of similar types of saving.) Also, the suggested cost saving is sufficiently small so that it should have a negligible effect on macroeconomic policymaking and related economic outcomes. Savings captured by these efforts should be deployed to generate sizeable saving across the US Government broadly by reducing fraudulent transactions and improper payments. In all, the US Government, the nation, and Black Americans can benefit from these two sets of saving efforts, which should result in improved wellbeing all around.
B Robinson
050324
Appendix I(7)

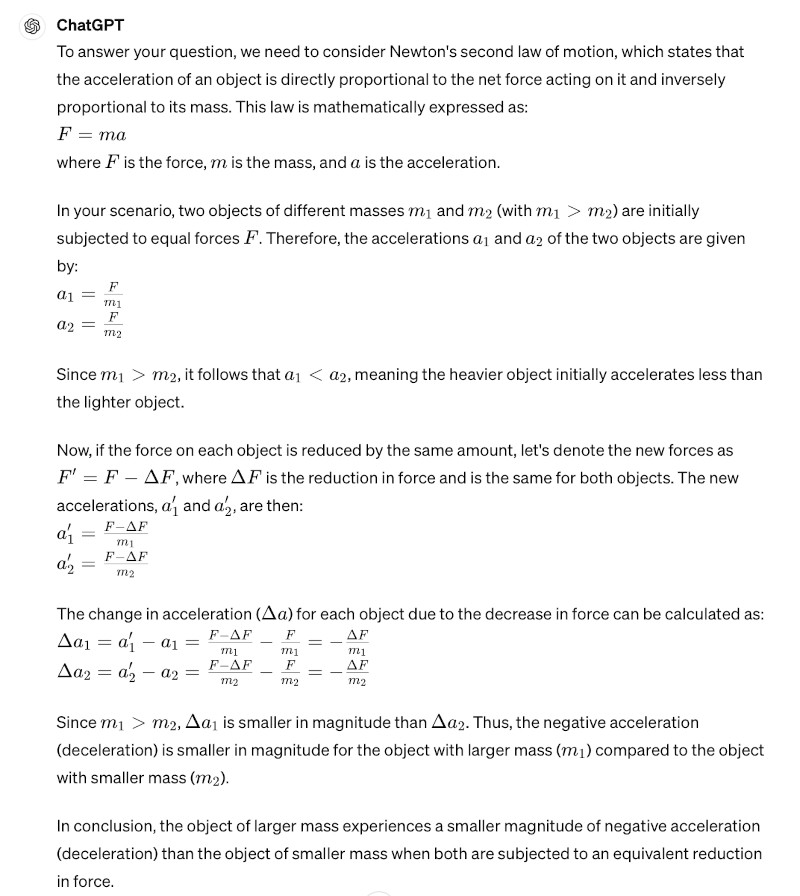
Source: ChatGPT4’s response to questions formulated by BlackEconomics.org.
1 For a framework with estimates that may be used to augment other estimates to determine a comprehensive Reparations value, see Brooks Robinson (2023), “A Direct Measure of a Black Americans Reparations Amount,” BlackEconomics.org; https://www.blackeconomics.org/BELit/admoabara112523.pdf (Ret 042424). Also, the multiple forms of payment that we support include land, financial and nonfinancial assets, commitments for the provision of services, and assistance in conducting international affairs. See Brooks Robbinson (2015), “A Broad Three-Point Reparations Program for US Afrodescendants Versus CARICOM’s 10-Point Program,” BlackEconomics.org; https://www.blackeconomics.org/BELit/btprp.pdf (Ret. 042424).
2 Table 1 estimates were prepared from World Economic Outlook data from the IMF (April 2024); https://www.imf.org/en/Publications/WEO/weo-database/2024/April/download-entire-database (Ret. 042224). The Following EXCEL functions were used to compute average growth rates (AverageA), variances (VarA), and standard deviations (STDEVA). Relative Standard Deviations (RSD) were computed as: RSD=((standard deviations*100)/average growth rates). The world’s top 20 largest economies measured by forecasted nominal GDP for 2024 by the IMF were identified at https://en.wikipedia.org/wiki/List_of_countries_by_GDP_(nominal) (Ret. 042424).
3 See Eugene Seskin and Shelly Smith (2008). “Annual Revision of the National Income and Product Accounts: Annual Estimates for 2005-200y; Quarterly Estimates for 2005:I-2008:I. Survey of Current Business. August, p.18.
4 See Statistics Netherlands (2016), “CBS Launching Center of Big Data Statistics;” https://www.cbs.nl/en-gb/about-us/innovation/nieuwsberichten/big-data/cbs-launching-center-for-big-data-statistics (Ret. 042424).
5 See International Monetary Fund (2018), “IMF Executive Board Supports New Strategy for Data and Statistics in the Digital Age;” https://www.imf.org/en/News/Articles/2018/03/20/pr1899imf-executive-board-supports-new-strategy-for-data-and-statistics-in-the-digital-age (Ret. 042424).
6 Brooks Robinson (2024). “Can Crime Pay the Black American (Afrodescendant) Reparations Bill?” BlackEconomics.org. https://www.blackeconomics.org/BELit/ccptbarb042624.pdf; (Ret. 042924).
7 BlackEconomics.org extends appreciation to Prof. Peter Gorham of the University of Hawaii-Manoa’s Department of Physics and Astronomy for pushing through the chatGPT4 console questions that we formulated concerning Newton’s Second Law of Motion to doubly confirm answers that we generated. Prof. Gorham is unaware of the use of these results. Also, provision of these results should not be construed as his support for, or approval of, this report brief.