

Black Americans made up 13.6% of the US population in 2022 and 54.1% of the victims of murder and non-negligent manslaughter, aka homicide. That works out, according to Centers for Disease Control and Prevention data, to a homicide rate of 29.8 per 100,000 Black Americans and four per 100,000 of everybody else.(1)
A homicide rate of four per 100,000 is still quite high by wealthy-nation standards. The most up-to-date statistics available from the Organization for Economic Cooperation and Development show a homicide of rate one per 100,000 in Canada as of 2019, 0.8 in Australia (2021), 0.4 in France (2017) and Germany (2020), 0.3 in the UK (2020) and 0.2 in Japan (2020).
But 29.8 per 100,000 is appalling, similar to or higher than the homicide rates of notoriously dangerous Brazil, Colombia and Mexico. It also represents a sharp increase from the early and mid-2010s, when the Black homicide rate in the US hit new (post-1968) lows and so did the gap between it and the rate for everybody else. When the homicide rate goes up, Black Americans suffer disproportionately. When it falls, as it did last year and appears to be doing again this year, it is mostly Black lives that are saved.
As hinted in the chart, racial definitions have changed a bit lately; the US Census Bureau and other government statistics agencies have become more open to classifying Americans as multiracial. The statistics cited in the first paragraph of this column are for those counted as Black or African American only. An additional 1.4% of the US population was Black and one or more other race in 2022, according to the Census Bureau, but the CDC Wonder (for “Wide-ranging Online Data for Epidemiologic Research”) databases from which most of the statistics in this column are drawn don’t provide population estimates or calculate mortality rates for this group. My estimate is that its homicide rate in 2022 was about six per 100,000.
A more detailed breakdown by race, ethnicity and gender reveals that Asian Americans had by far the lowest homicide rate in 2022, 1.6, which didn’t rise during the pandemic, that Hispanic Americans had similar homicide rates to the nation as a whole and that men were more than four times likelier than women to die by homicide in 2022. The biggest standout remained the homicide rate for Black Americans.
Black people are also more likely to be victims of other violent crime, although the differential is smaller than with homicides. In the 2021 National Crime Victimization Survey from the Bureau of Justice Statistics (the 2022 edition will be out soon), the rate of violent crime victimization was 18.5 per 1,000 Black Americans, 16.1 for Whites, 15.9 for Hispanics and 9.9 for Asians, Native Hawaiians and other Pacific Islanders. Understandably, Black Americans are more concerned about crime than others, with 81% telling Pew Research Center pollsters before the 2022 midterm elections that violent crime was a “very important” issue, compared with 65% of Hispanics and 56% of Whites.
These disparities mainly involve communities caught in cycles of violence, not external predators. Of the killers of Black Americans in 2020 whose race was known, 89.4% were Black, according to the FBI. That doesn’t make those deaths any less of a tragedy or public health emergency. Homicide is seventh on the CDC’s list of the 15 leading causes of death among Black Americans, while for other Americans it’s nowhere near the top 15. For Black men ages 15 to 39, the highest-risk group, it’s usually No. 1, although in 2022 the rise in accidental drug overdoses appears to have pushed accidents just past it. For other young men, it’s a distant third behind accidents and suicides.
To be clear, I do not have a solution for this awful problem, or even much of an explanation. But the CDC statistics make clear that sky-high Black homicide rates are not inevitable. They were much lower just a few years ago, for one thing, and they’re far lower in some parts of the US than in others. Here are the overall 2022 homicide rates for the country’s 30 most populous metropolitan areas.
Metropolitan areas are agglomerations of counties by which economic and demographic data are frequently reported, but seldom crime statistics because the patchwork of different law enforcement agencies in each metro area makes it so hard. Even the CDC, which gets its mortality data from state health departments, doesn’t make it easy, which is why I stopped at 30 metro areas.(2)
Sorting the data this way does obscure one key fact about homicide rates: They tend to be much higher in the main city of a metro area than in the surrounding suburbs.
But looking at homicides by metro area allows for more informative comparisons across regions than city crime statistics do, given that cities vary in how much territory they cover and how well they reflect an area’s demographic makeup. Because the CDC suppresses mortality data for privacy reasons whenever there are fewer than 10 deaths to report, large metro areas are good vehicles for looking at racial disparities. Here are the 30 largest metro areas, ranked by the gap between the homicide rates for Black residents and for everybody else.
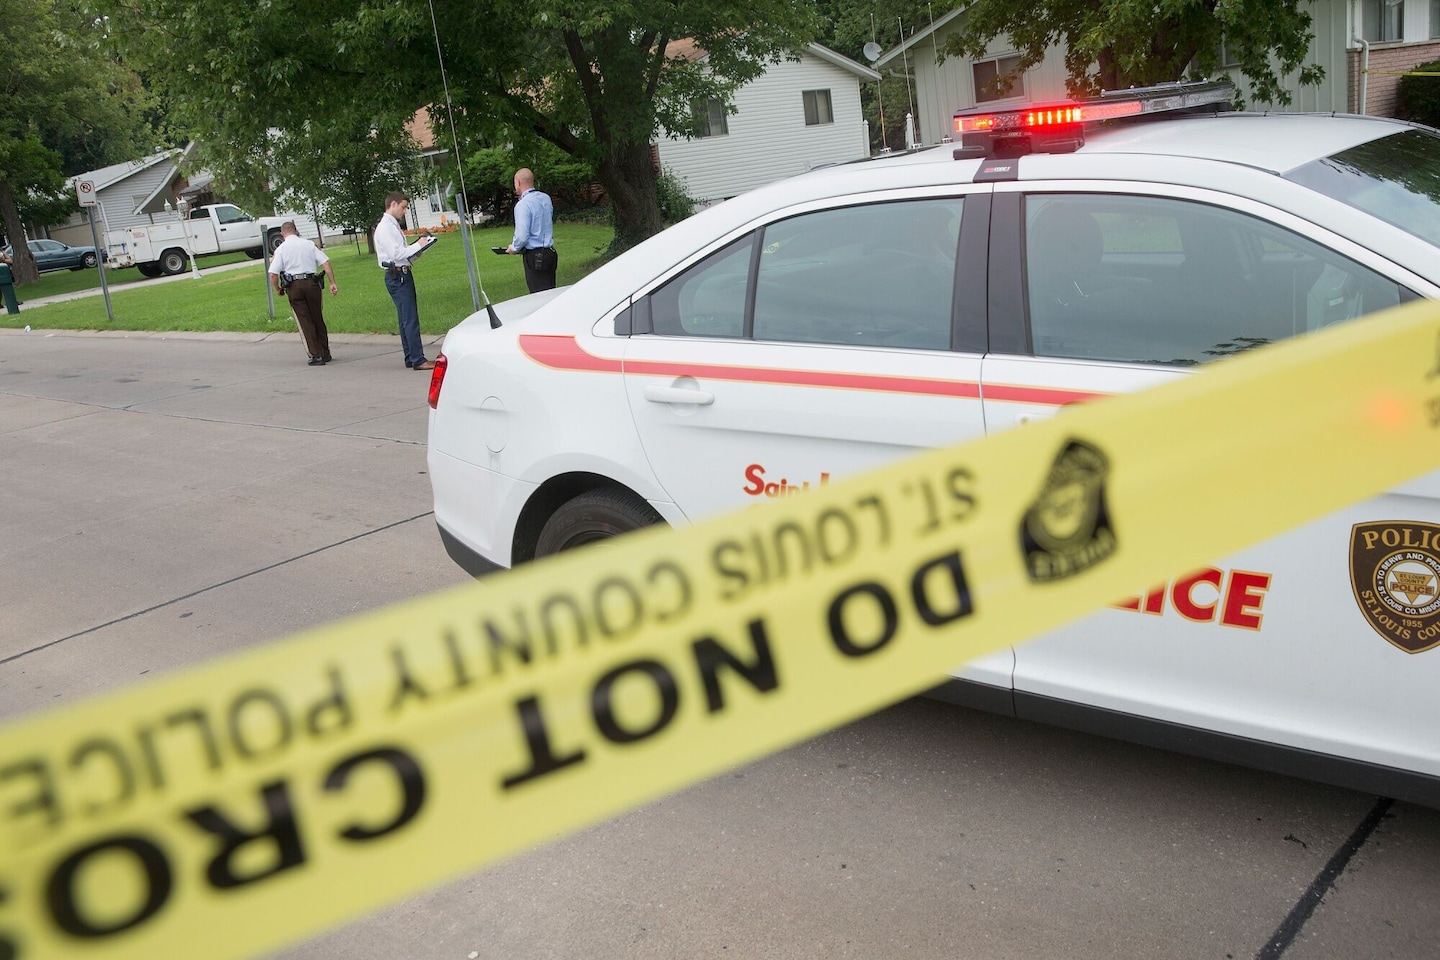
The biggest gap by far is in metropolitan St. Louis, which also has the highest overall homicide rate. The smallest gaps are in metropolitan San Diego, New York and Boston, which have the lowest homicide rates. Homicide rates are higher for everybody in metro St. Louis than in metro New York, but for Black residents they’re six times higher while for everyone else they’re just less than twice as high.
There do seem to be some regional patterns to this mayhem. The metro areas with the biggest racial gaps are (with the glaring exception of Portland, Oregon) mostly in the Rust Belt, those with the smallest are mostly (with the glaring exceptions of Boston and New York) in the Sun Belt. Look at a map of Black homicide rates by state, and the highest are clustered along the Mississippi River and its major tributaries. Southern states outside of that zone and Western states occupy roughly the same middle ground, while the Northeast and a few middle-of-the-country states with small Black populations are the safest for their Black inhabitants.(3)
Metropolitan areas in the Rust Belt and parts of the South stand out for the isolation of their Black residents, according to a 2021 study of Census data from Brown University’s Diversity and Disparities Project, with the average Black person living in a neighborhood that is 60% or more Black in the Detroit; Jackson, Mississippi; Memphis; Chicago; Cleveland and Milwaukee metro areas in 2020 (in metro St. Louis the percentage was 57.6%). Then again, metro New York and Boston score near the top on another of the project’s measures of residential segregation, which tracks the percentage of a minority group’s members who live in neighborhoods where they are over-concentrated compared with White residents, so segregation clearly doesn’t explain everything.
Looking at changes over time in homicide rates may explain more. Here’s the long view for Black residents of the three biggest metro areas. Again, racial definitions have changed recently. This time I’ve used the new, narrower definition of Black or African American for 2018 onward, and given estimates in a footnote of how much it biases the rates upward compared with the old definition.
All three metro areas had very high Black homicide rates in the 1970s and 1980s, and all three experienced big declines in the 1990s and 2000s. But metro Chicago’s stayed relatively high in the early 2010s then began a rebound in mid-decade that as of 2021 had brought the homicide rate for its Black residents to a record high, even factoring in the boost to the rate from the definitional change.
What happened in Chicago? One answer may lie in the growing body of research documenting what some have called the “Ferguson effect,” in which incidents of police violence that go viral and beget widespread protests are followed by local increases in violent crime, most likely because police pull back on enforcement. Ferguson is the St. Louis suburb where a 2014 killing by police that local prosecutors and the US Justice Department later deemed to have been in self-defense led to widespread protests that were followed by big increases in St. Louis-area homicide rates. Baltimore had a similar viral death in police custody and homicide-rate increase in 2015. In Chicago, it was the October 2014 shooting death of a teenager, and more specifically the release a year later of a video that contradicted police accounts of the incident, leading eventually to the conviction of a police officer for second-degree murder.
It’s not that police killings themselves are a leading cause of death among Black Americans. The Mapping Police Violence database lists 285 killings of Black victims by police in 2022, and the CDC reports 209 Black victims of “legal intervention,” compared with 13,435 Black homicide victims. And while Black Americans are killed by police at a higher rate relative to population than White Americans, this disparity — 2.9 to 1 since 2013, according to Mapping Police Violence — is much less than the 7.5-to-1 ratio for homicides overall in 2022. It’s the loss of trust between law enforcement agencies and the communities they serve that seems to be disproportionately deadly for Black residents of those communities.
The May 2020 murder of George Floyd by a Minneapolis police officer was the most viral such incident yet, leading to protests nationwide and even abroad, as well as an abortive local attempt to disband and replace the police department. The Minneapolis area subsequently experienced large increases in homicides and especially homicides of Black residents. But nine other large metro areas experienced even bigger increases in the Black homicide rate from 2019 to 2022.
A lot of other things happened between 2019 and 2022 besides the Floyd protests, of course, and I certainly wouldn’t ascribe all or most of the pandemic homicide-rate increase to the Ferguson effect. It is interesting, though, that the St. Louis area experienced one of the smallest percentage increases in the Black homicide rate during this period, and it decreased in metro Baltimore.
Also interesting is that the metro areas experiencing the biggest percentage increases in Black residents’ homicide rates were all in the West (if your definition of West is expansive enough to include San Antonio). If this were confined to affluent areas such as Portland, Seattle, San Diego and San Francisco, I could probably spin a plausible-sounding story about it being linked to especially stringent pandemic policies and high work-from-home rates, but that doesn’t fit Phoenix, San Antonio or Las Vegas, so I think I should just admit that I’m stumped.
The standout in a bad way has been the Portland area, which had some of the longest-running and most contentious protests over policing, along with many other sources of dysfunction. The area’s homicide rate for Black residents has more than tripled since 2019 and is now second highest among the 30 biggest metro areas after St. Louis. Again, I don’t have any real solutions to offer here, but whatever the Portland area has been doing since 2019 isn’t working.
More From Bloomberg Opinion’s Justin Fox:
• Pandemic Murder Wave Crests. Here’s the Postmortem.
• More US Youths Are Dying, But Not From Vaccines
• Fighting Crime Takes More Police, Less Prosecution
(1) The CDC data for 2022 are provisional, with a few revisions still being made in the causes assigned to deaths (was it a homicide or an accident, for example), but I’ve been watching for weeks now, and the changes have been minimal. The CDC is still using 2021 population numbers to calculate 2022 mortality rates, and when it updates those, the homicide rates will change again, but again only slightly. The metropolitan-area numbers also don’t reflect a recent update by the White House Office of Management and Budget to its list of metro areas and the counties that belong to them, which when incorporated will bring yet more small mortality-rate changes. To get these statistics from the CDC mortality databases, I clicked on “Injury Intent and Mechanism” and then on “Homicide”; in some past columns I instead chose “ICD-10 Codes” and then “Assault,” which delivered slightly different numbers.
(2) It’s easy to download mortality statistics by metro area for the years 1999 to 2016, but the databases covering earlier and later years do not offer this option, and one instead has to select all the counties in a metro area to get area-wide statistics, which takes a while.
(3) The map covers the years 2018-2022 to maximize the number of states for which CDC Wonder will cough up data, although as you can see it wouldn’t divulge any numbers for Idaho, Maine, Vermont and Wyoming (meaning there were fewer than 10 homicides of Black residents in each state over that period) and given the small numbers involved, I wouldn’t put a whole lot of stock in the rates for the Dakotas, Hawaii, Maine and Montana.
This column does not necessarily reflect the opinion of the editorial board or Bloomberg LP and its owners.
Justin Fox is a Bloomberg Opinion columnist covering business, economics and other topics involving charts. A former editor and writer at the Harvard Business Review, Time and Fortune, he is author of “The Myth of the Rational Market.”
More stories like this are available on bloomberg.com/opinion
©2023 Bloomberg L.P.